Success Plans: Gantt Chart View
Success Plan [old version] documents will be archived soon...Documents related to the old Success Plan feature will be archived soon and will no longer be available as all the NXT customers now have Success Plan Horizon Experience in their orgs. Learn about the improved version of Success Plan on Horizon Experience through documents which can be accessed from here.
Gainsight NXT
Introduction
This article explains the Gantt Chart view in Customer Success Plans. For more information on managing Success Plans, refer to Create Success plans in C360.
Gantt Chart is a type of bar chart that illustrates the progress of scheduled tasks against a defined criteria. You can find Gantt Chart as one of the tabs within the Success Plans section of the 360. This tab provides a graphical representation of all the objectives listed in the OBJECTIVES tab against the planned schedule. You can have an instant overview of the owners and the respective objectives, associated tasks, and important dates.
Click GANTT CHART tab, in the C360/R360 > Success Plans section, to navigate to the Gantt Chart view for the selected customer.
Gantt Chart List View
Gantt Chart List view displays the list of Objectives and the associated tasks in each Objective.
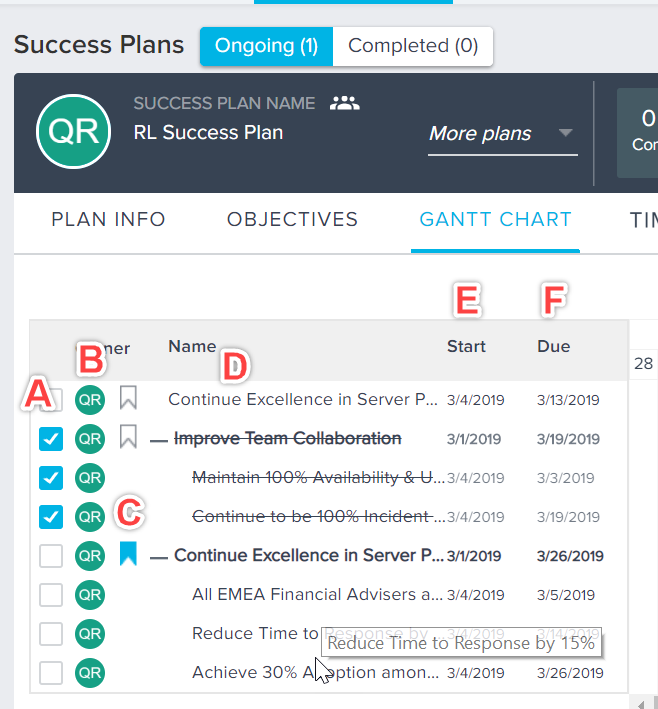
The following are the List View columns and actions that you can perform in the Gantt Chart:
- Checkbox: Select this to close CTAs and Tasks from Gantt Chart.
- Owner: Hover over this image to view the name of the owner.
- Important Flag: Select this flag to mark a CTA as important.
- Name: Displays all the objectives and the associated tasks. Hover over to view the complete objective or task name.
Note: By default, the task list is expanded in an Objective but you can minimize as required.
- Start Date: By default, the start date of the CTA objectives and tasks begin at the respective created date. CSMs can modify this Start Date from the Gantt Chart based on their requirement.
- Due Date: Displays the due date of the selected objective or task. You can modify the due date based on your requirement.
Note: You can also edit the Owner (for both Objectives and Tasks). To change the owner, click on the Owner icon and search for the required owner.
When the due date for an objective is greater than the success plan due date, the success plan due date is updated to reflect the latest due date.
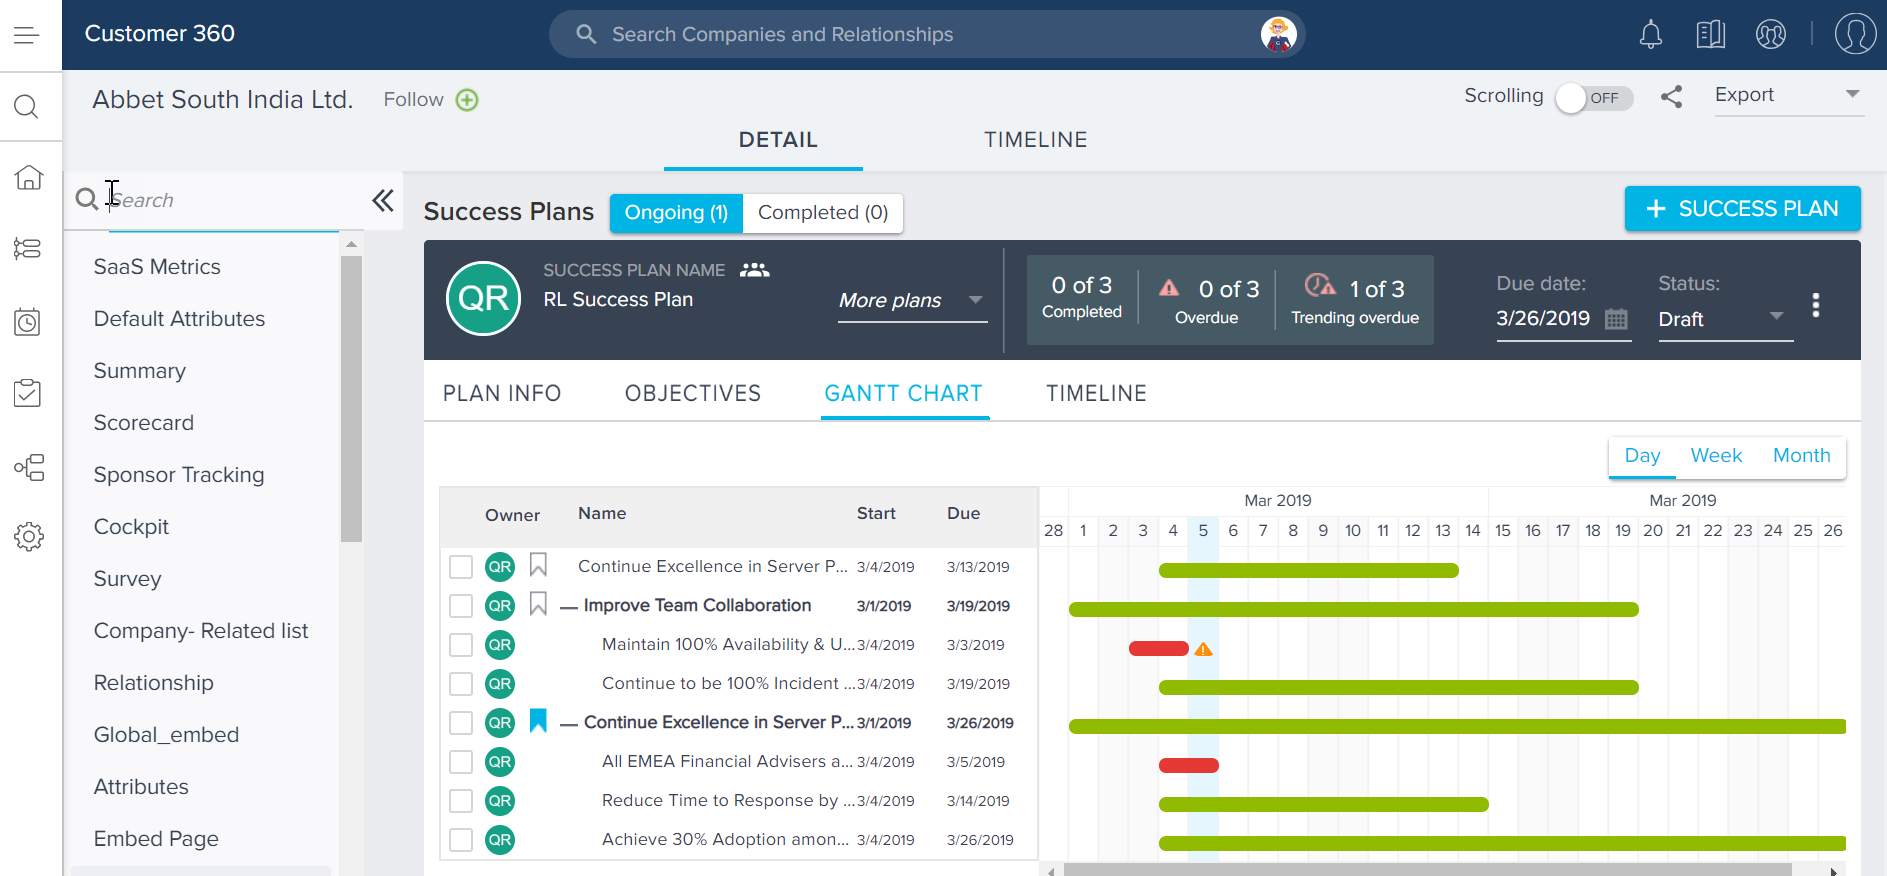
Gantt Chart Bar Chart View
Bar chart view displays the progress of the respective objectives and tasks from the list view against the planned schedule. You can also view the daily, weekly, and monthly details of all objectives listed in the OBJECTIVES tab against the planned schedule.
Colors and Symbols Representation in Bar Chart
The bar representation of the CTA objectives and tasks begins at the respective start date and ends at the due date in a Calendar. The following colors and symbols are illustrated in the bar chart view:
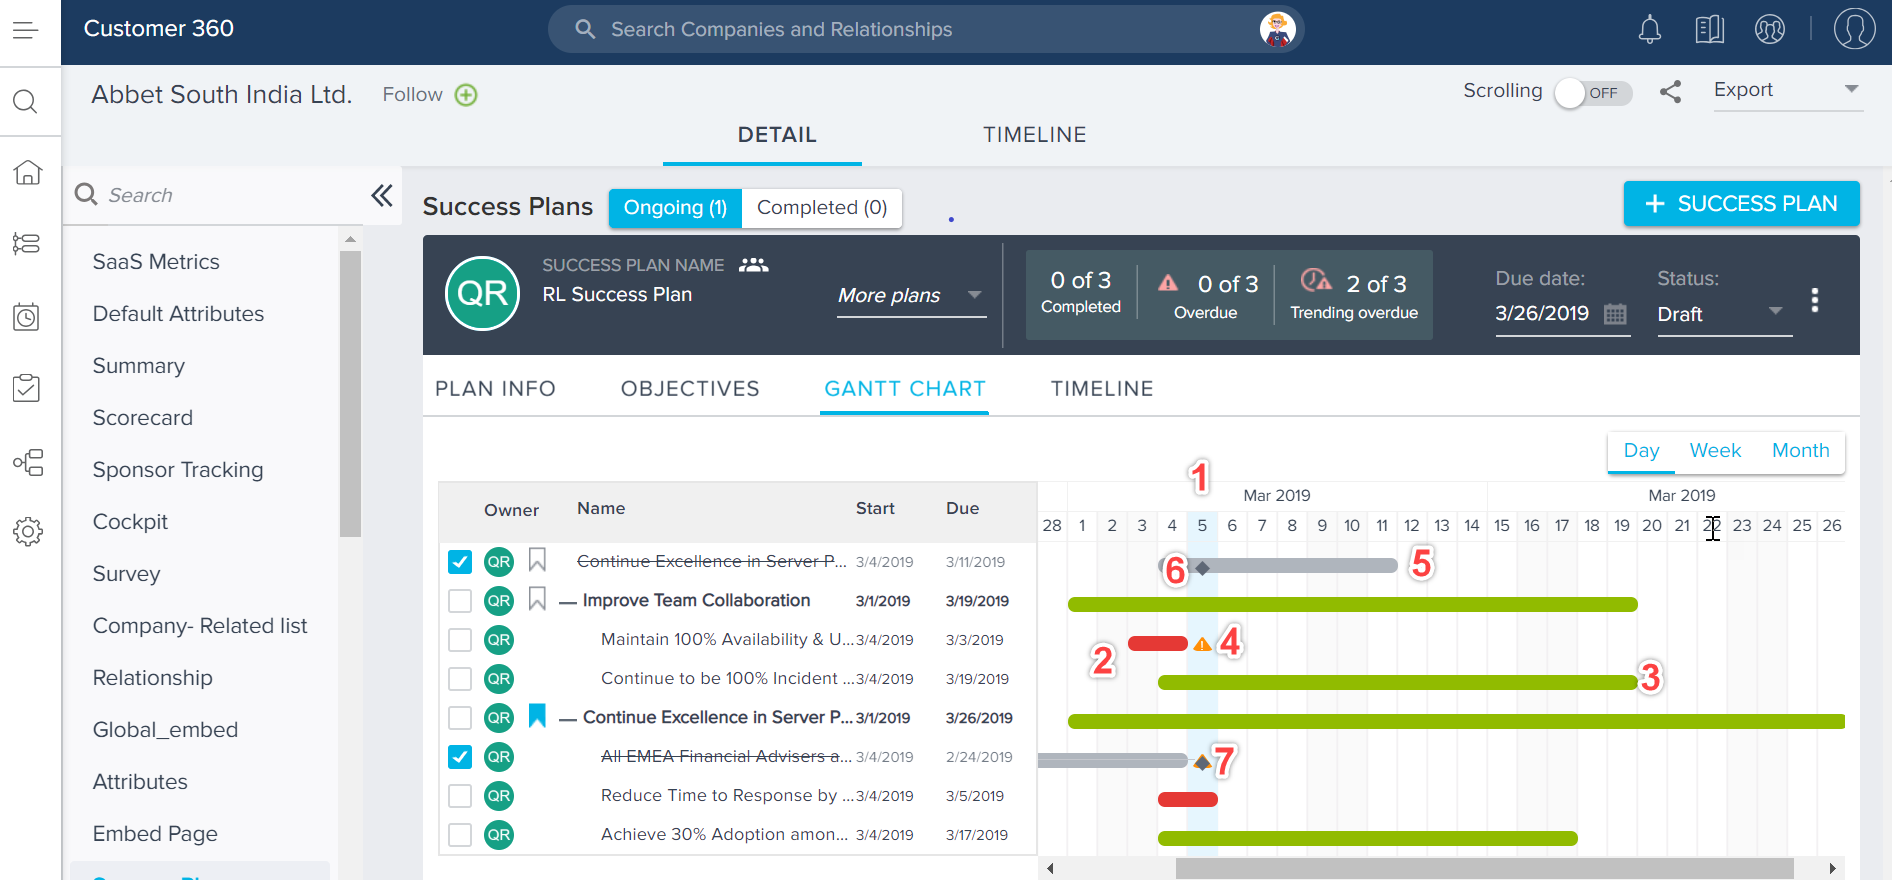
- Blue Vertical Line: Represents Today’s Date and is the beginning of the bar chart. If the current date is not the objective/task Start Date, use the scroll-bar at the bottom of the chart to move the chart to the left or right.
- Red Bar: Represents open and overdue CTA or task.
- Green Bar: Represents open CTA or task.
- Orange Triangle with Exclamation Mark: Represents Due Date is less than Start Date.
- Gray Bar: Represents Closed CTA or task.
- Dark Gray pointer inside the Gray Bar: Represents the Closed Date is earlier than the Due Date.
- Extended Dark Gray pointer outside the Gray Bar: Represents the Closed Date is later than the Due Date.
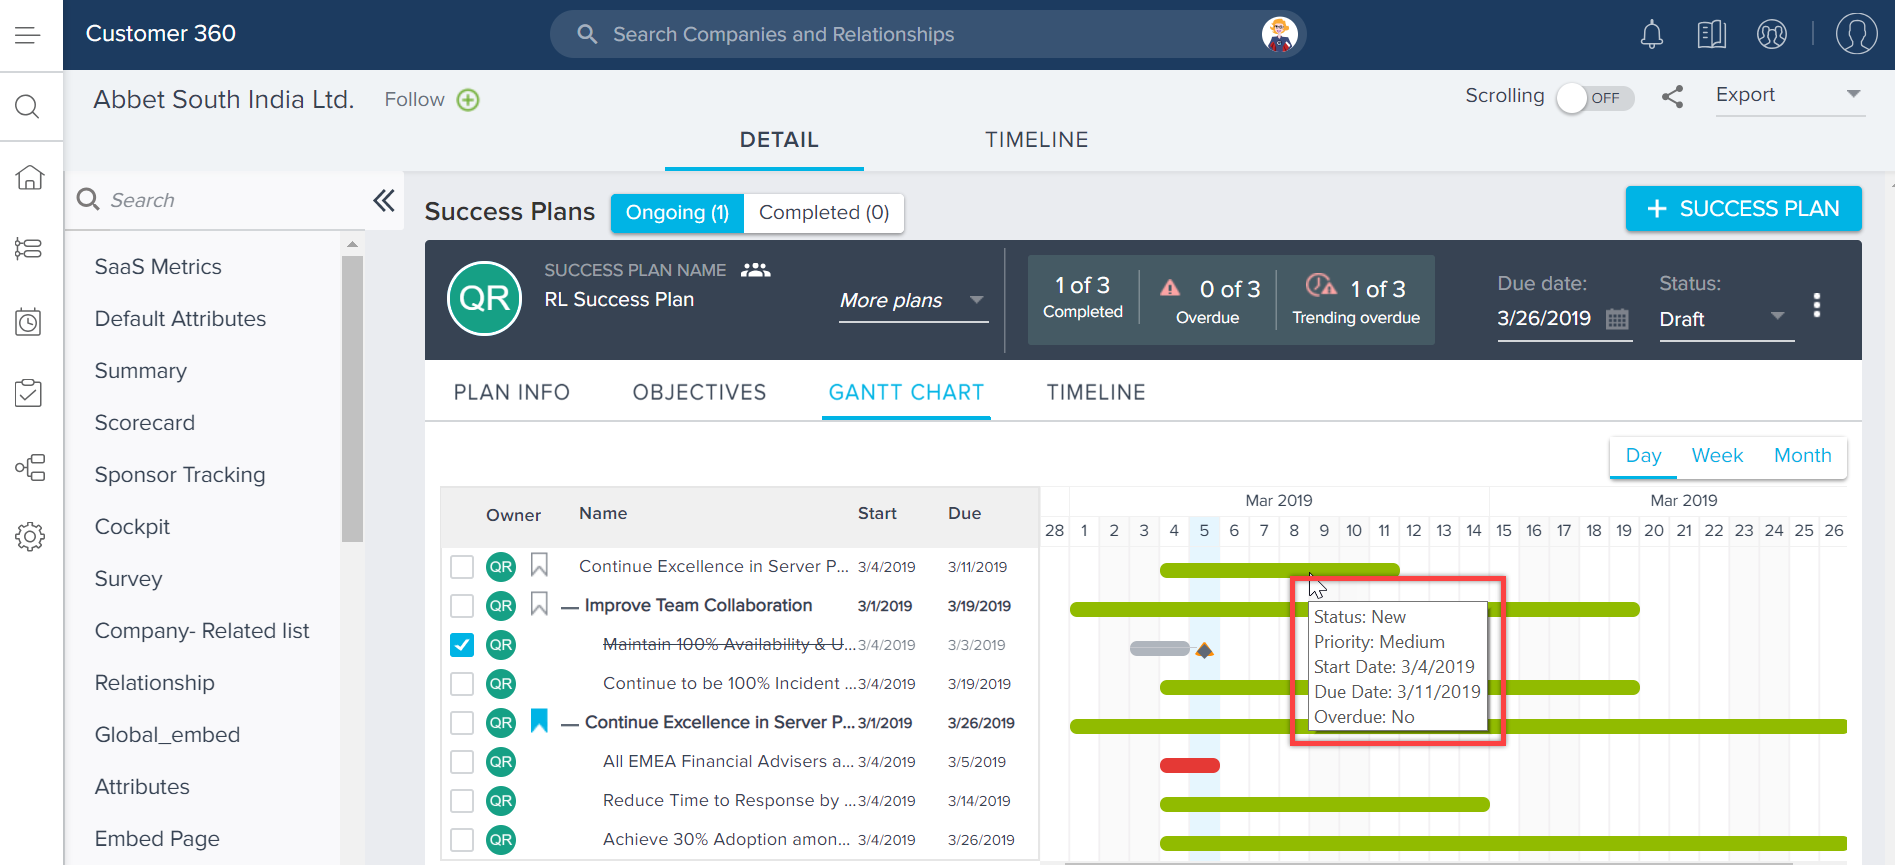
You can also hover over any bar in the Graph to view the following details:
- Status
- Priority
- Start Date
- Due Date
- Overdue