How User State Preservation works with Dashboards
Gainsight NXT
This article describes how “User State Preservation” works in Dashboards, and in particular, when admins make changes to the reports in the Report Builder.
What is User State Preservation: Selections or actions made by a user on Dashboards are remembered and their most recent selection or action persists when they return to the page after navigating away.
Selections/Actions - User State Preserved
The following selections or actions in Reporting are “User State Preserved”:
- Report Filters
- Visualization Type
- Ranking
- Chart Options
- Table Options
Report Filters
Modifying Existing Filters
Filters are User State Preserved, which enables multiple users to have their own state maintained on the filters. When admins make any changes to the Filters on a report on which a CSM has already modified to have his own state of filters, those changes are not automatically propagated to the Dashboards tab, instead CSM’s state prevails.
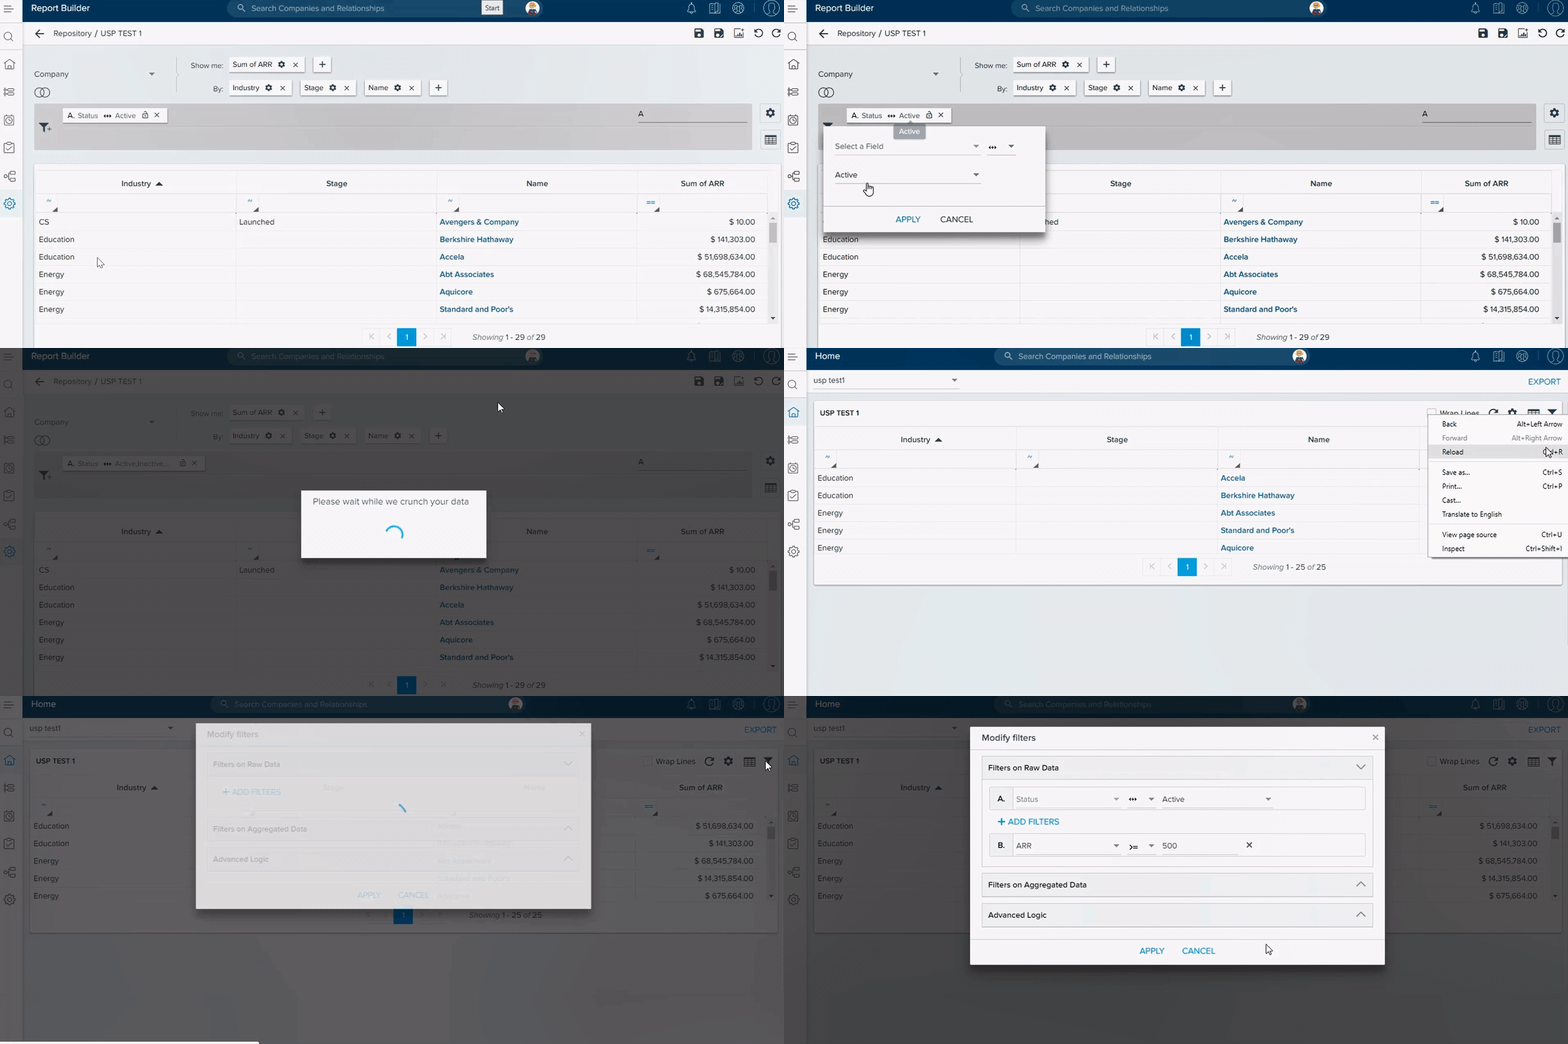
The following use case explains how User State Preservation works when Filters are modified:
- Navigate to Administration > Analytics > Report Builder.
- Select a report from the repository.
- Click on the existing report filter to modify it.
- Click Save.
- Navigate to Dashboards.
- Select the relevant dashboard from the dropdown list, under which the relevant report is available.
You see that the changes made above are not propagated to the Dashboards due to User State Preservation.
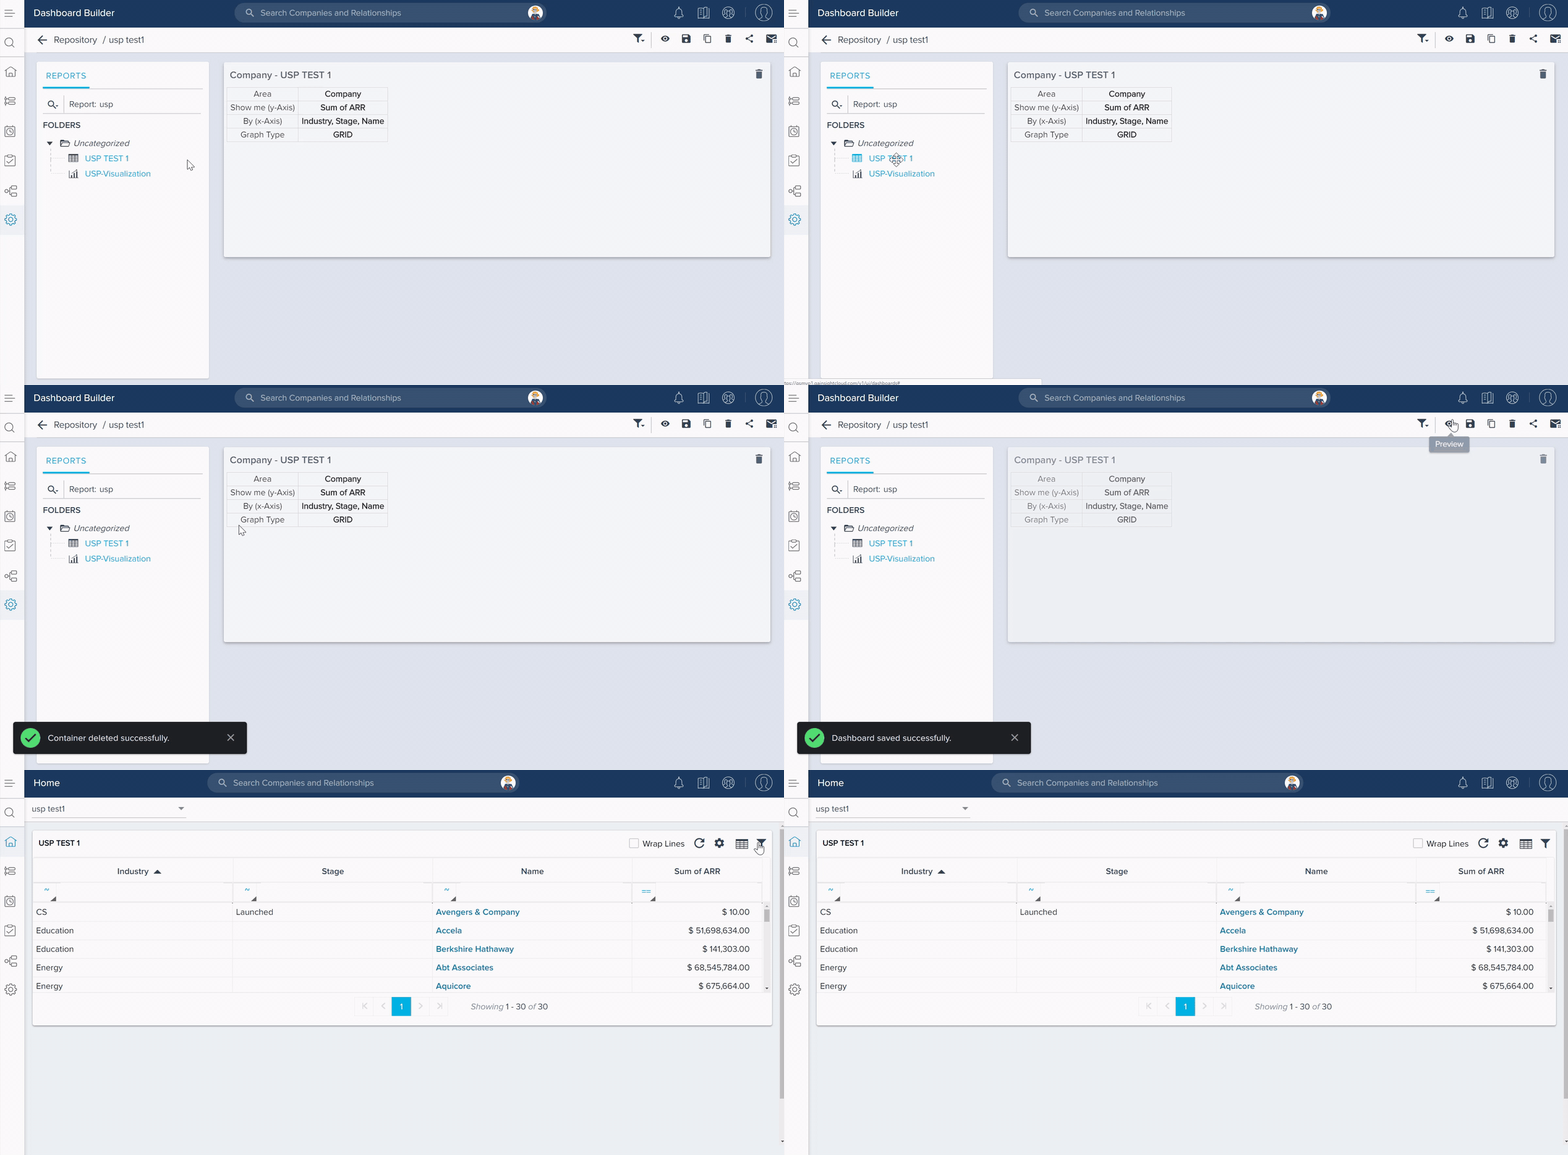
To propagate any changes made to the report filter to Dashboards, remove the report from the dashboard and add it again.
Visualization Type
Visualization Types are User State Preserved which enables multiple users to have their own state preserved. When admins make any changes to the Visualization Type for a report on which a CSM has already modified to have his own state of visualization type, those changes are not automatically propagated to the Dashboards tab, instead CSM’s state prevails.
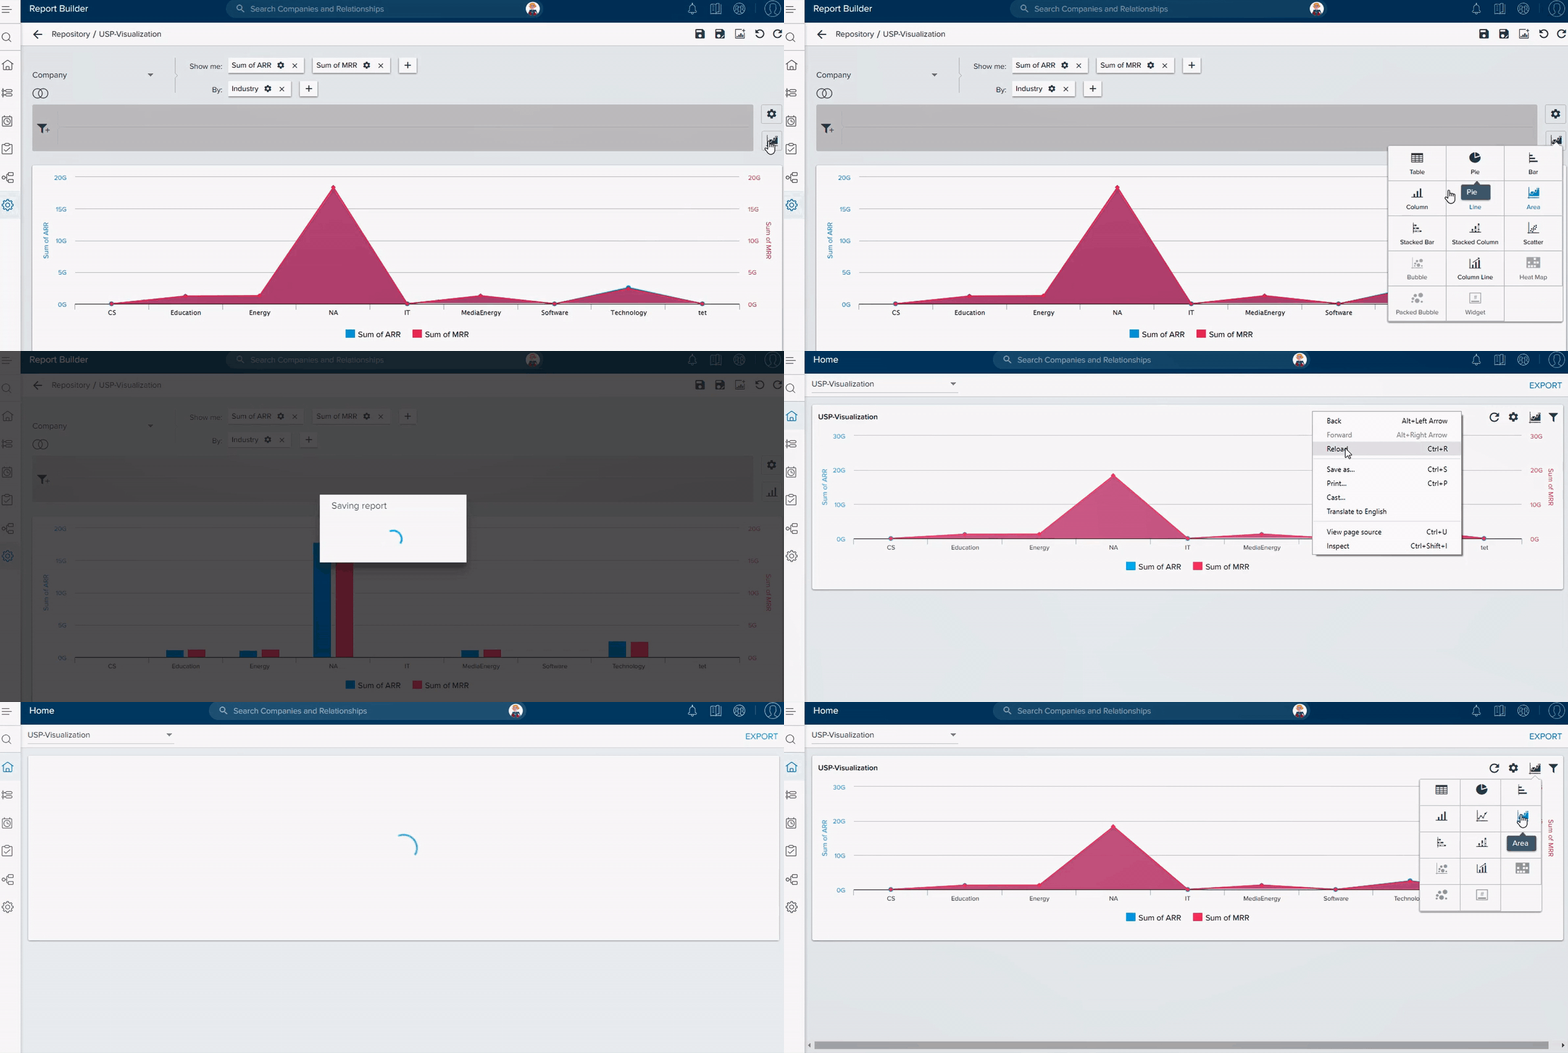
The following use case explains how User State Preservation works with Visualization Type:
- Navigate to Administration > Analytics > Report Builder.
- Select a report from the repository.
- Click Select Visualization Type to modify the type from Area chart to Column chart.
- Click Save.
- Navigate to Dashboards.
- Select the relevant dashboard from the dropdown list, under which the relevant report is available.
You see that the changes made above are not propagated to the Dashboards due to User State Preservation.
Ranking
Ranking assigned for Reports by a CSM on the Dashboards tab is User State Preserved, which enables multiple users to have their own state preserved. When admins make any changes to the Ranking for a report on which a CSM has already modified to have his own state of ranking, those changes are not automatically propagated to the Dashboards tab, instead CSM’s state prevails.
The following use case explains how User State Preservation works with Ranking:
- Navigate to Administration > Analytics > Report Builder.
- Select a report from the repository.
- Click the Settings/Gear icon on the report you want to assign ranking.
- Click Ranking to modify the existing setting.
- Click Save.
- Navigate to Dashboards.
- Select the relevant dashboard from the dropdown list, under which the relevant report is available.
You see that the changes made above are not propagated to Dashboards due to User State Preservation.
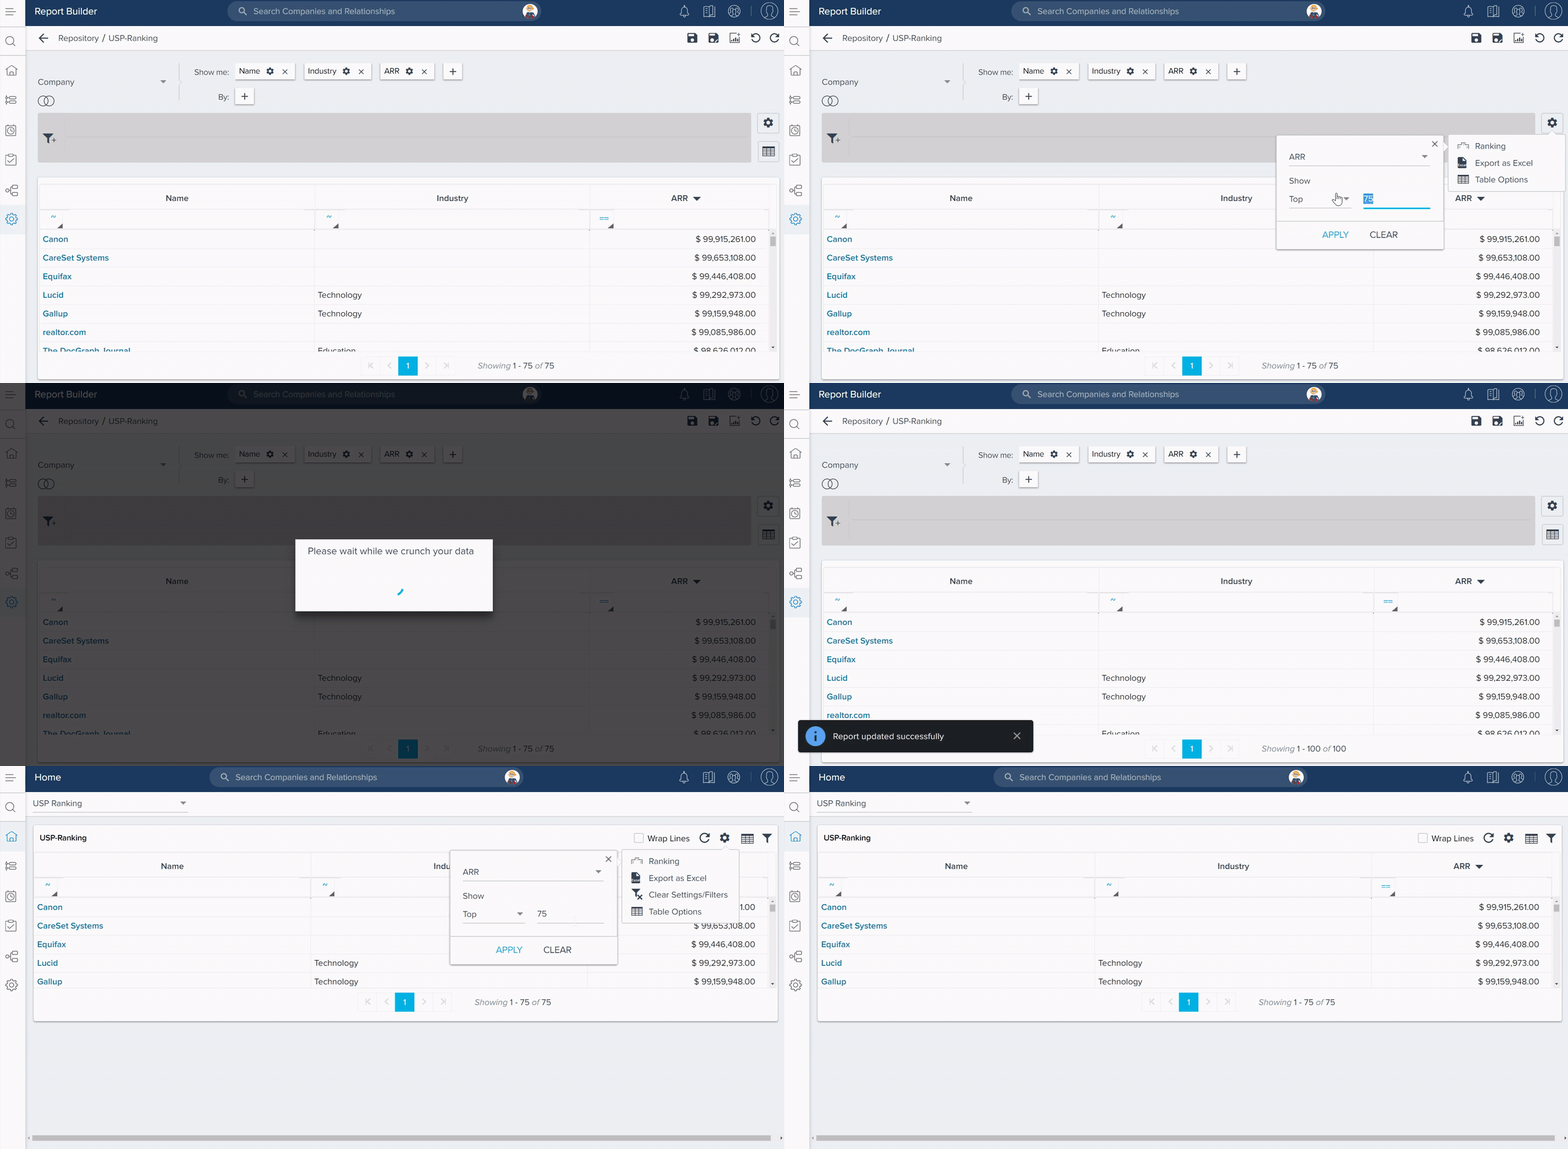
Chart Options
Chart Options assigned for Reports by a CSM on the Dashboards tab is User State Preserved, which enables multiple users to have their own state preserved. When admins make any changes to the Chart Options for a report on which a CSM has already modified to have his own state of chart options, those changes are not automatically propagated to the Dashboards tab, instead CSM’s state prevails.
The following use case explains how User State Preservation works with Chart Options:
- Navigate to Administration > Analytics > Report Builder.
- Select a report from the repository.
- Click the Settings/Gear icon on the report you want to assign Chart Options.
- Click Chart Options to modify the existing setting.
- Click Save.
- Navigate to Dashboards.
- Select the relevant dashboard from the dropdown list, under which the relevant report is available.
You see that the changes made above are not propagated to Dashboards due to User State Preservation.
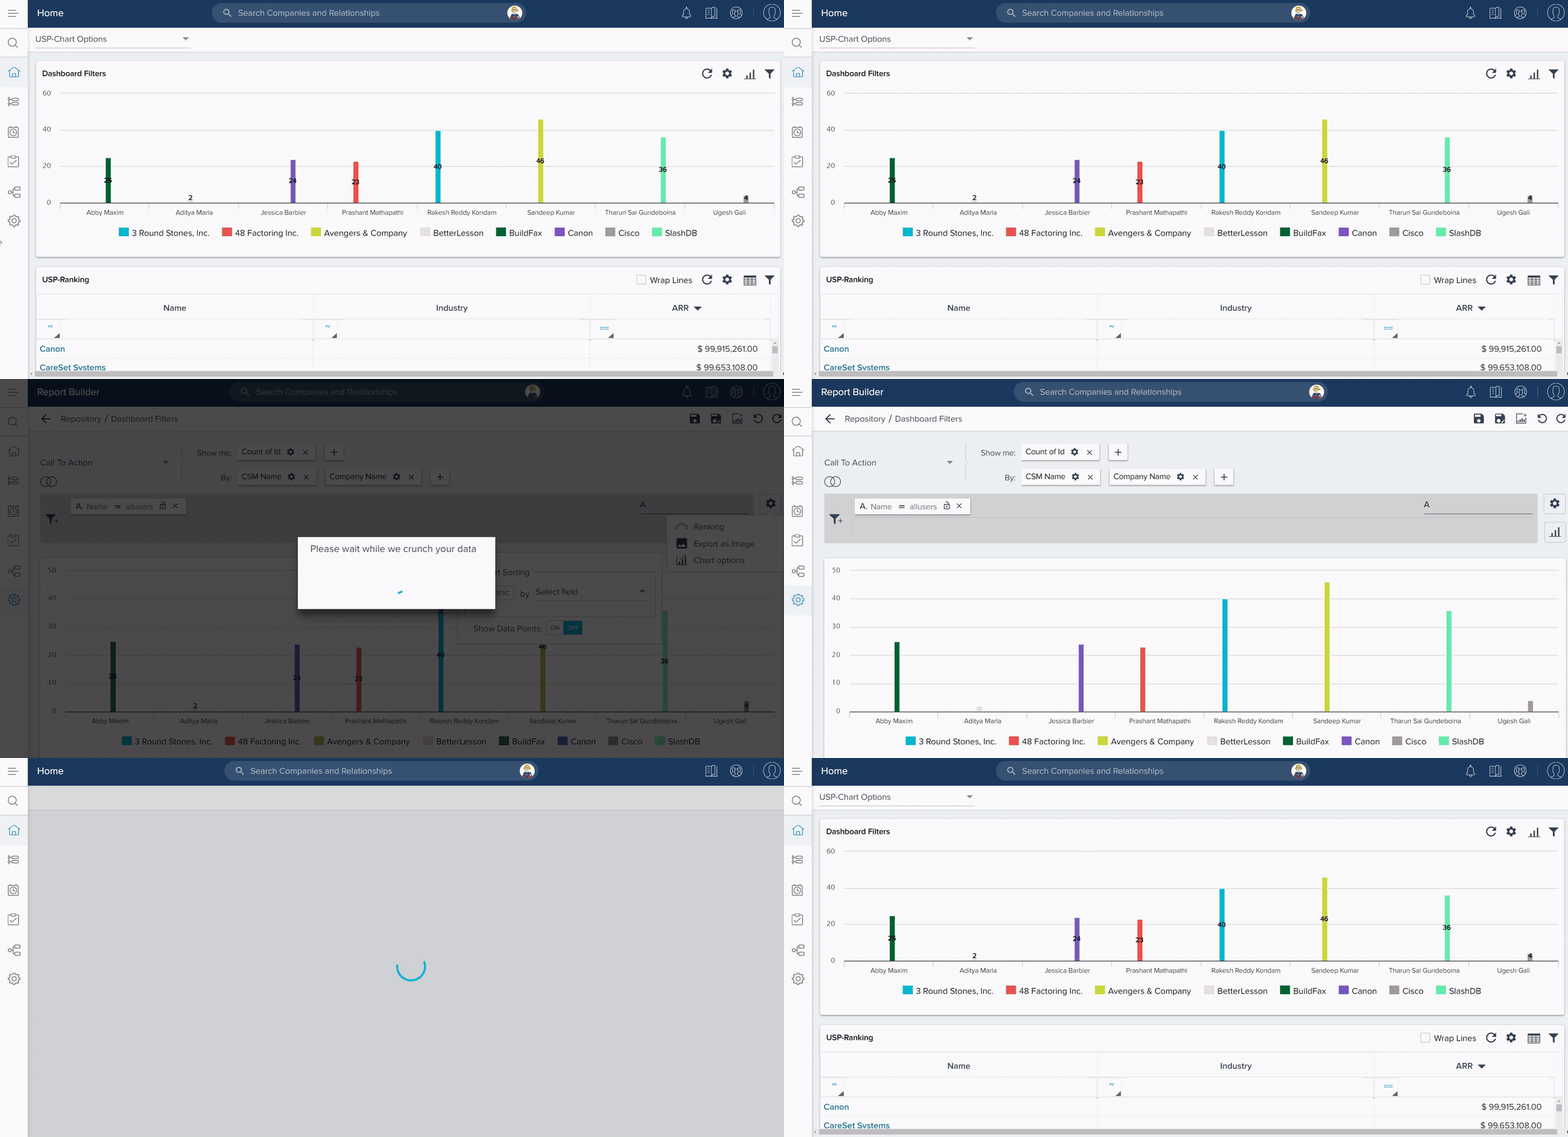
Table Options
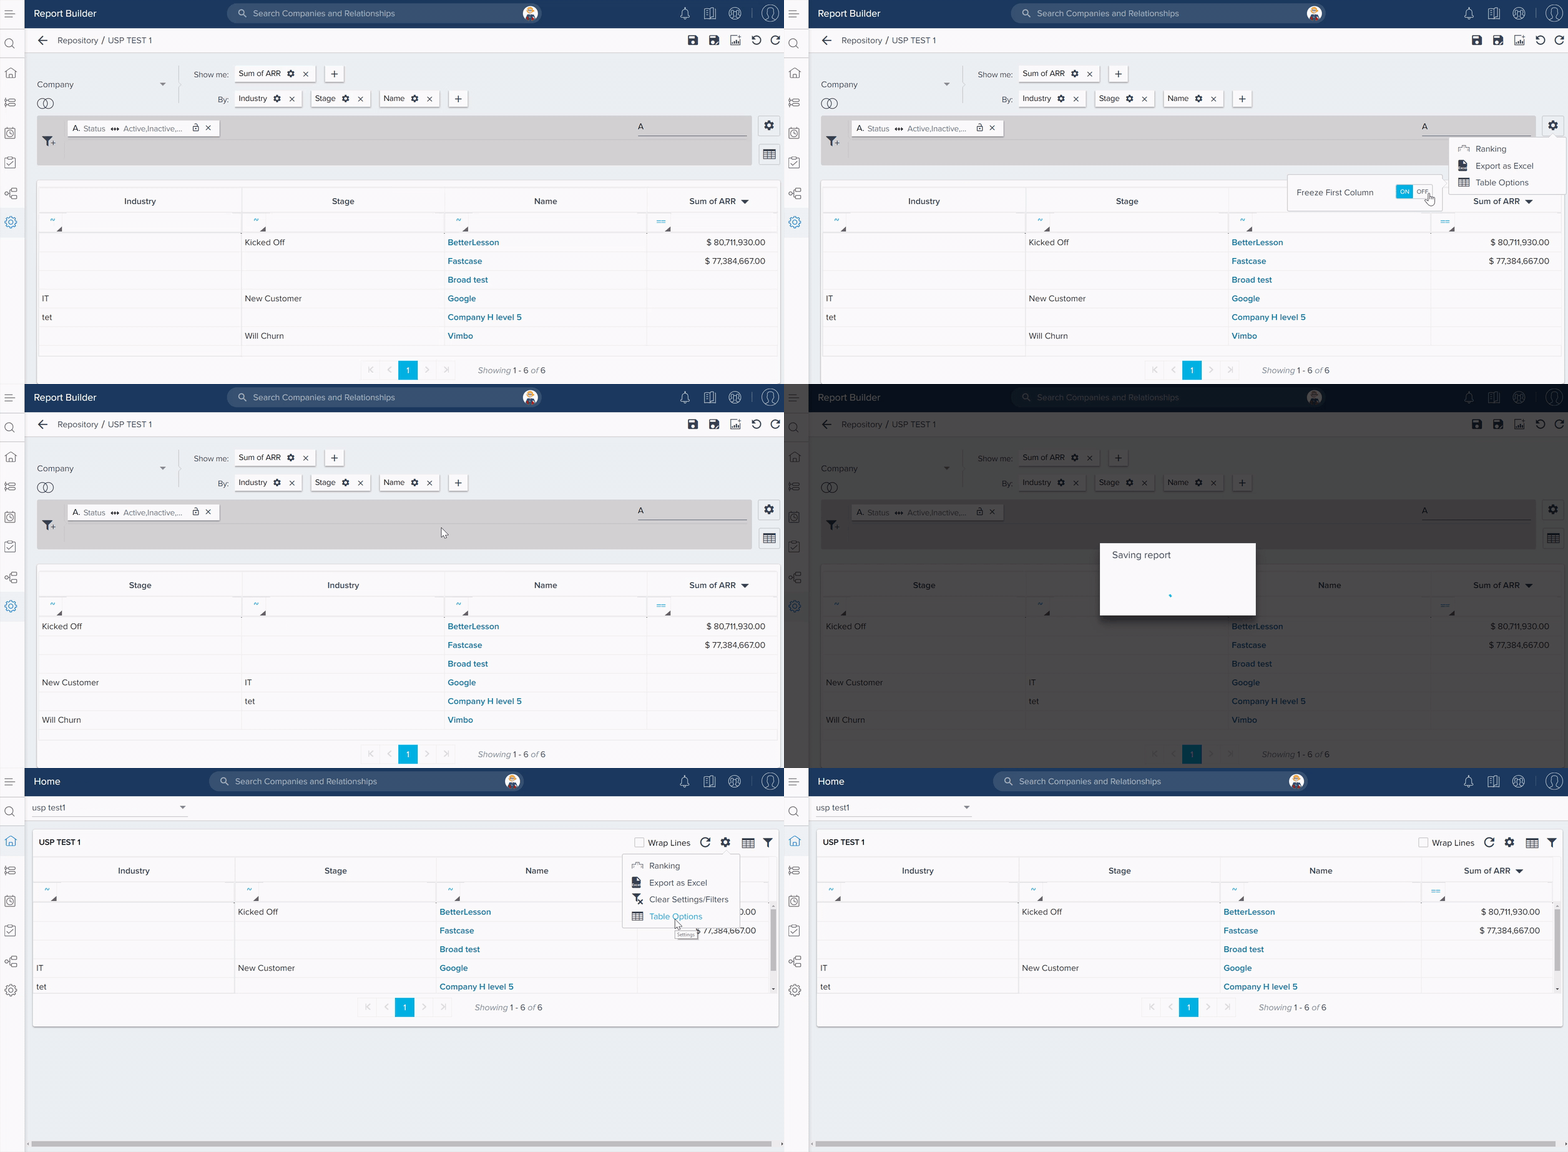
Table Options assigned for Reports by a CSM on the Dashboards tab is User State Preserved, which enables multiple users to have their own state preserved. When admins make any changes to the Table Options for a report on which a CSM has already modified to have his own state of table options, those changes are not automatically propagated to the Dashboards tab, instead CSM’s state prevails.
The following use case explains how User State Preservation works with Table Options:
- Navigate to Administration > Analytics > Report Builder.
- Select a report from the repository.
- Click the Settings/Gear icon on the report you want to assign Table Options.
- Click Table Options to modify the existing setting.
- Click Save.
- Navigate to Dashboards.
- Select the relevant dashboard from the dropdown list, under which the relevant report is available.
You see that the changes made above are not propagated to Dashboards due to User State Preservation.
To Remove User State Preservation
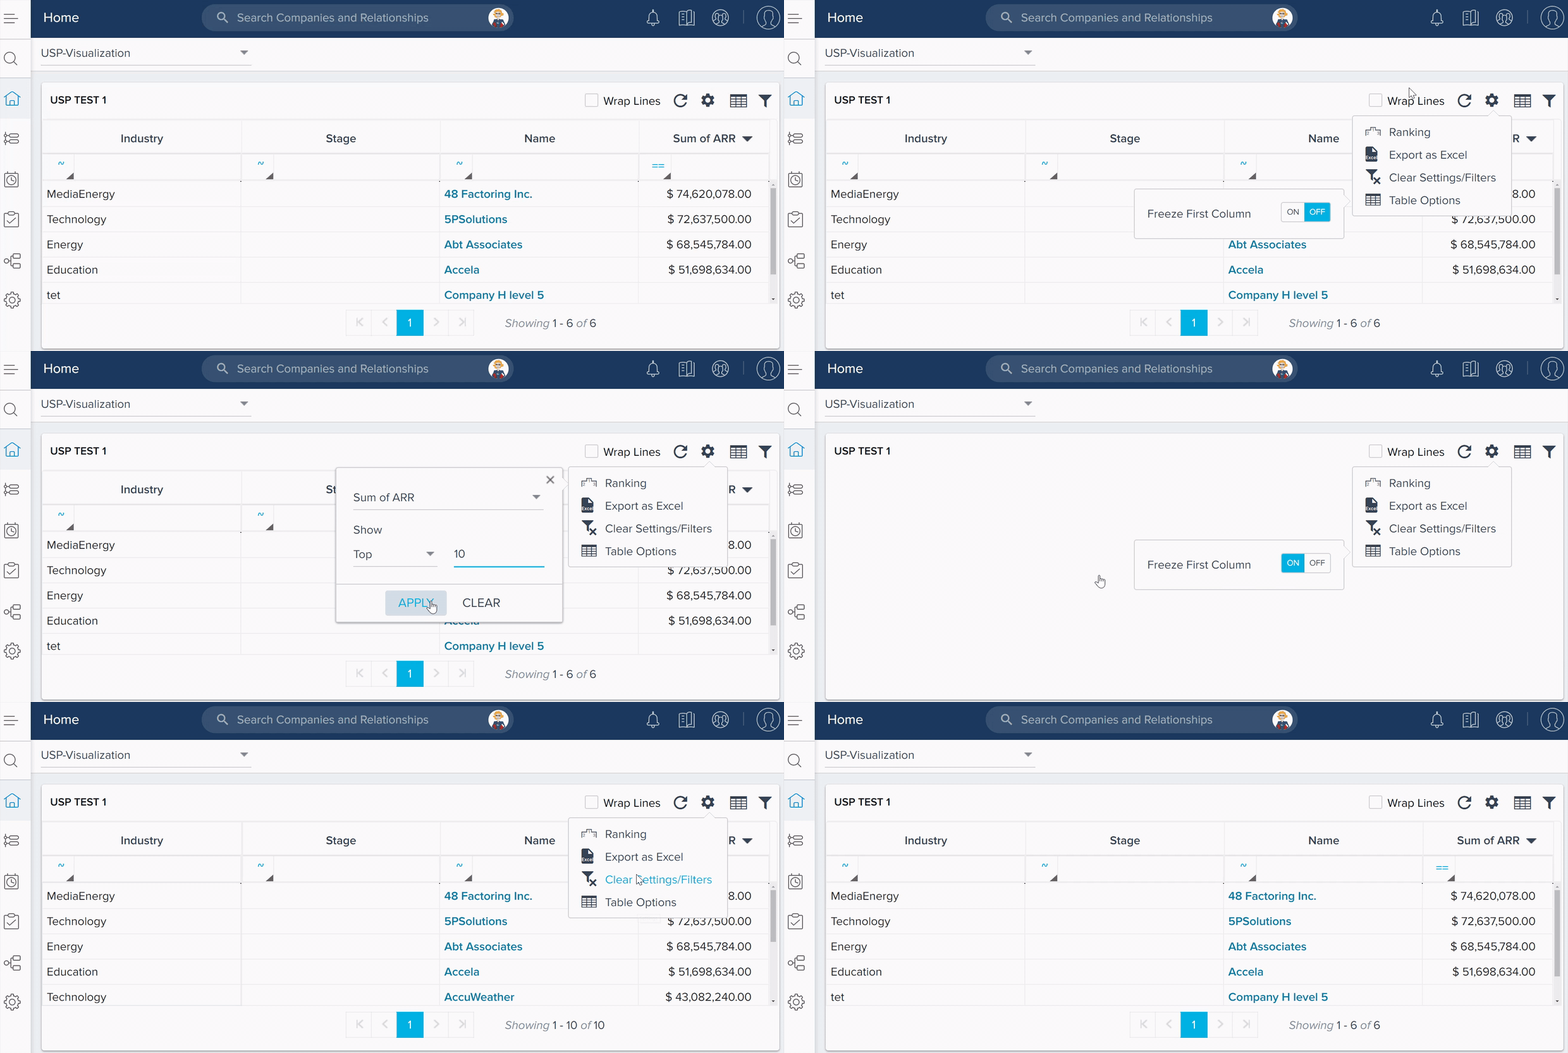
Users can clear all the state preserved selections/actions made by them on Dashboards. The following use case explains about how to remove the state preserved Ranking and Chart Options:
- Navigate to Dashboards.
- Click the Settings/Gear icon on the report you want to remove existing state preserved selections/actions.
- Click Clear Settings/Filters.
- Click YES.
Selections/Actions - Automatically Propagated to GS Home tab
The following structural changes to the report made by admin are automatically propagated to the Dashboards tab:
Show me
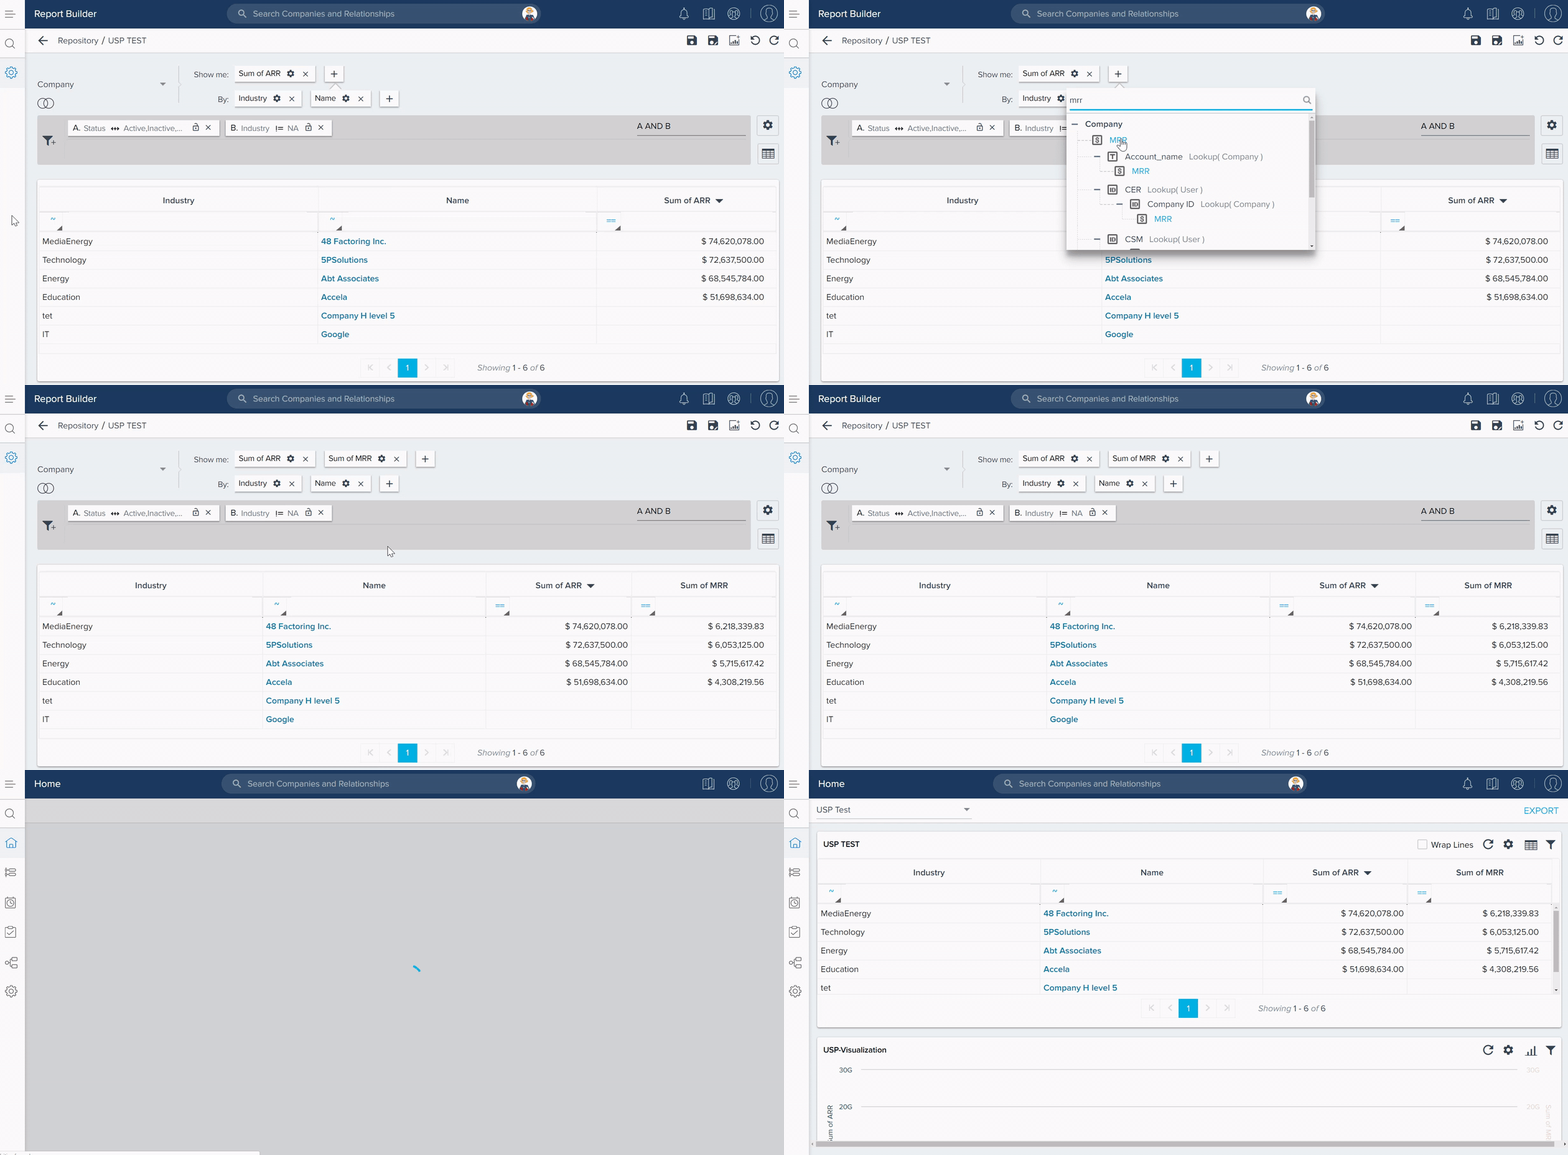
When admins add a new field to Show me, or removes a field from Show me to the report that already exists in a dashboard, the changes are propagated to Dashboards automatically.
The following use case explains about the Show me fields:
- Navigate to Administration > Analytics > Report Builder.
- Select a report from the repository.
- Click + on Show me to add an additional field.
- Click Save.
- Navigate to Dashboards.
- Select the relevant dashboard from the dropdown list, under which the relevant report is available.
CSMs can see the new Show me field in the latest dashboard on Dashboards.
By
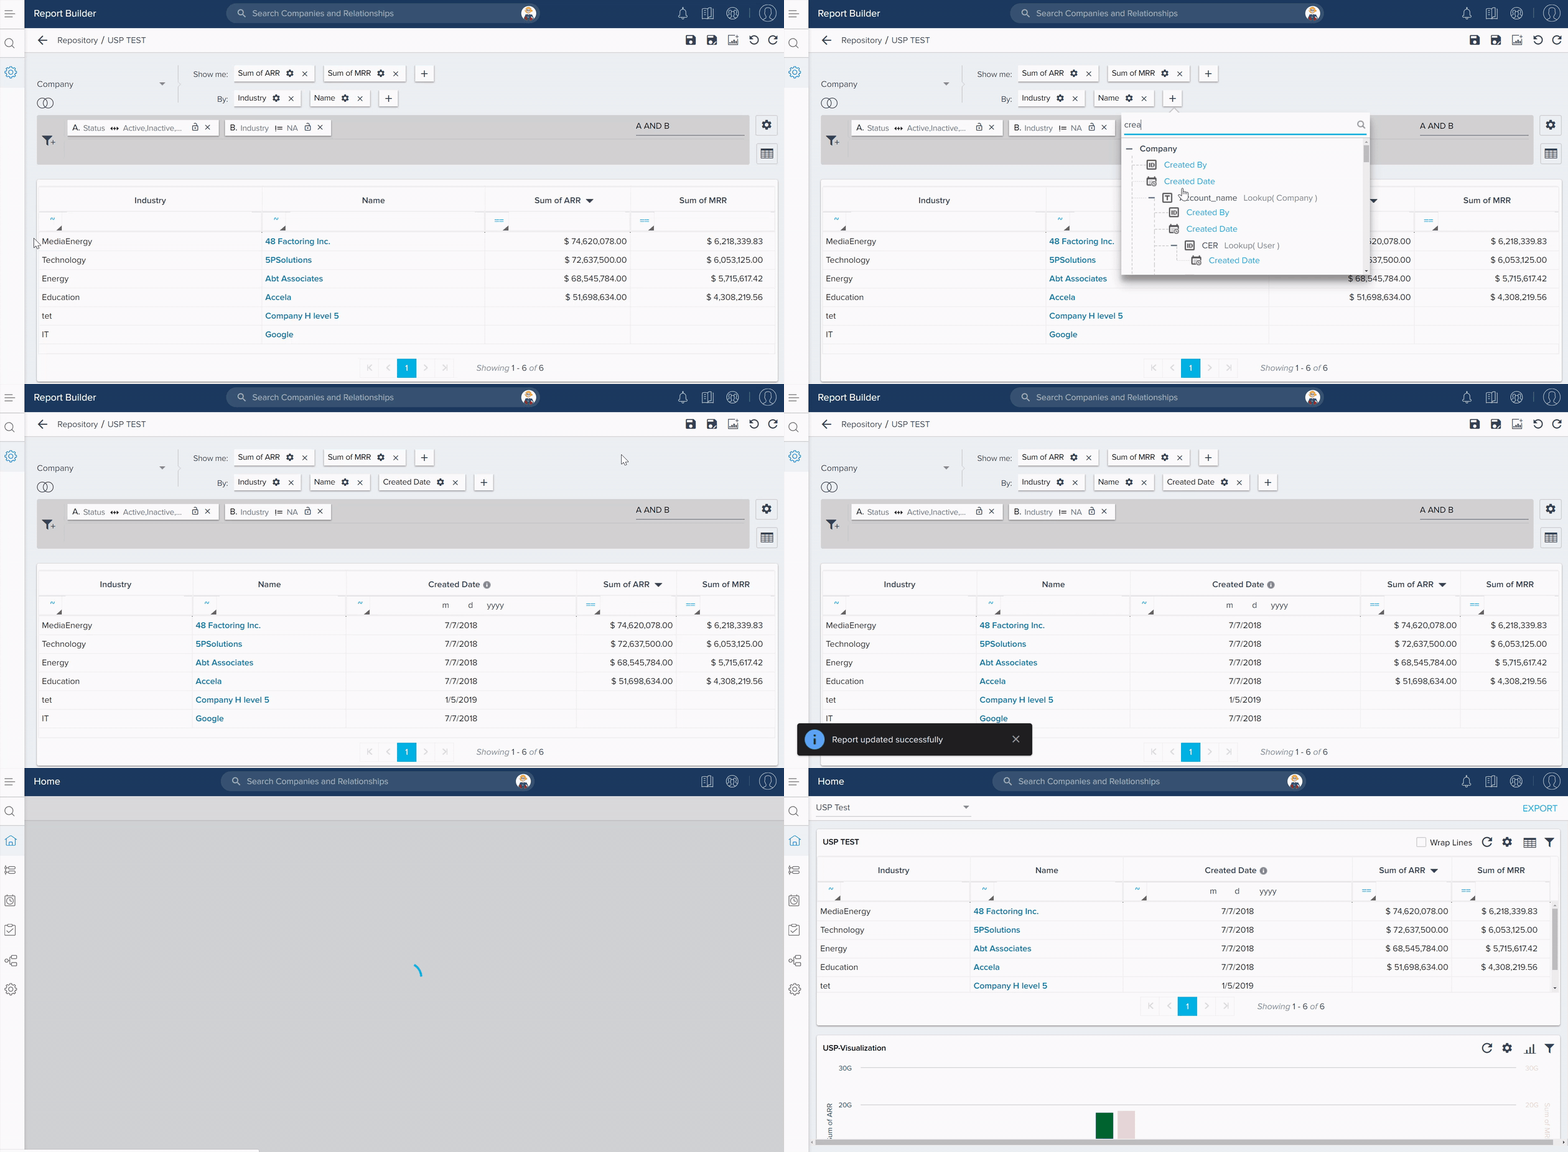
When admins add a new field to By, or removes a field from By to the report that already exists in a dashboard, the changes are propagated to Dashboards automatically.
The following use case explains about By fields:
- Navigate to Administration > Analytics > Report Builder.
- Select a report from the repository.
- Click + on By to add an additional field.
- Click Save.
- Navigate to Dashboards.
- Select the relevant dashboard from the dropdown list, under which the relevant report is available.
CSMs can see the new By field in the latest dashboard on Dashboards.
New Filters
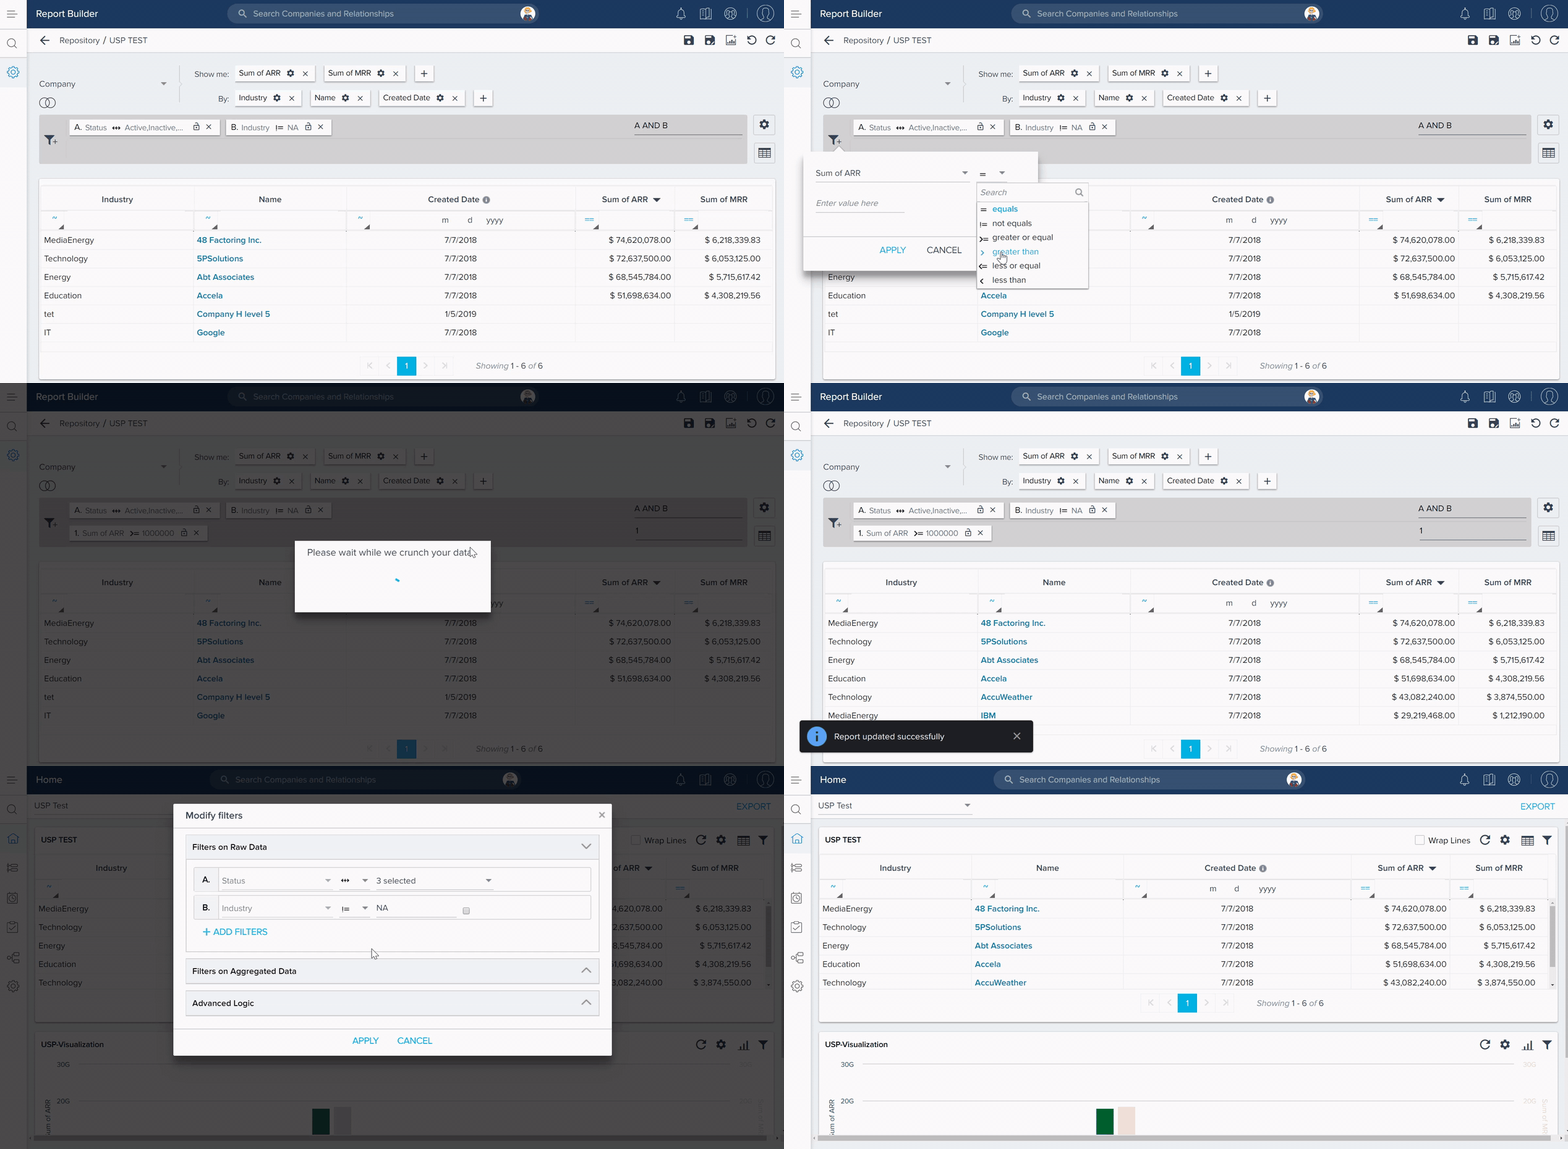
When admins add a new Filter to the report that already exists in a dashboard, the changes are propagated to Dashboards automatically.
The following use case explains about the New Filters:
- Navigate to Administration > Analytics > Report Builder.
- Select a report from the repository.
- Click the filter icon to add an additional filter.
- Click Save.
- Navigate to Dashboards.
- Select the relevant dashboard from the dropdown list, under which the relevant report is available.
CSM’s can see the new filter in the latest dashboard on Dashboards.
Selections/Actions - Not State Preserved
The following selections or actions in Reporting are “Not User State Preserved”:
Column Sorting
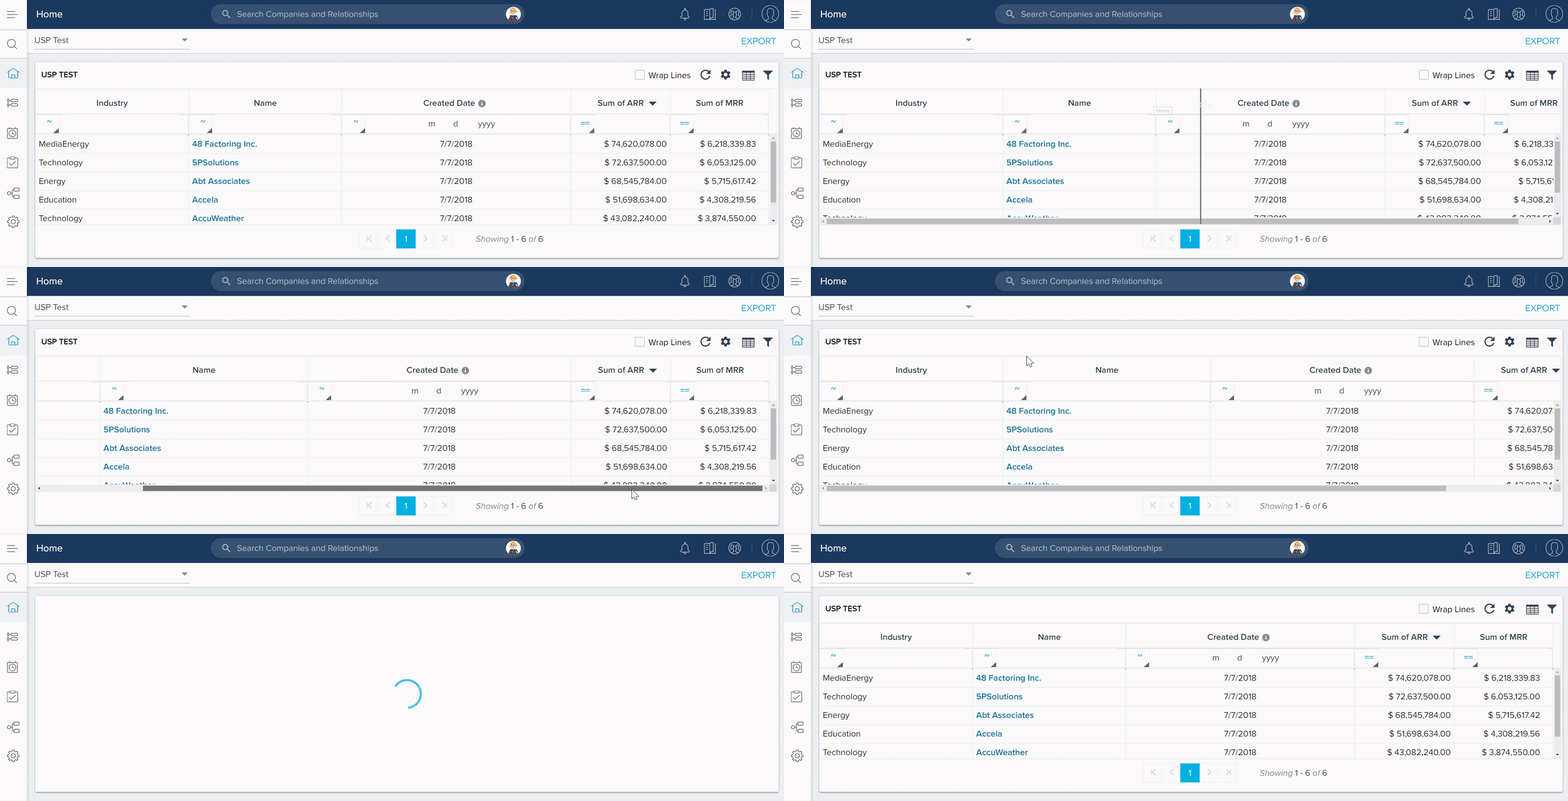
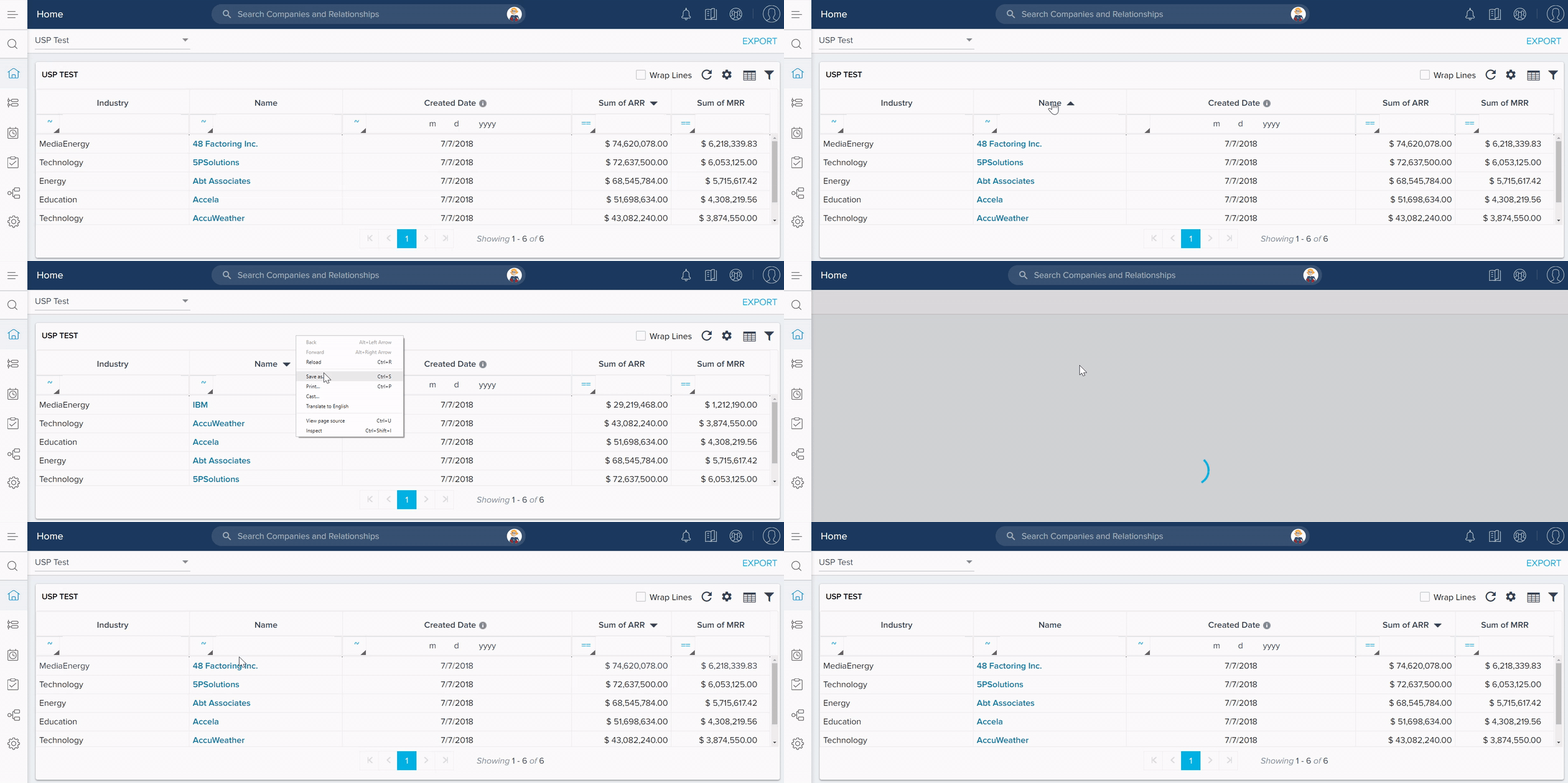
Sorting a table column in a report on Dashboards is not state preserved.
For instance, on Dashboards, when a CSM sorts the table column in a report, and refreshes the page, CSM cannot see the new changes made. Instead, the column sorting returns to the previous state as original.
Column Resizing
Resizing a table column in a report on Dashboards is not state preserved.
For instance, on Dashboards, when a CSM modifies the size of the table column in a report, and refreshes the page, CSM cannot see the new changes made. Instead, the column size returns to the previous state as original.
