Gainsight Integration with Tableau
Gainsight NXT
This article explains how admins can connect Tableau to Gainsight data and build reports on Gainsight Data in Tableau.
Overview
Gainsight’s integration with Tableau allows admins to quickly connect their “Gainsight NXT” and “Gainsight NXT in Salesforce” instances. This integration allows admins to access all the Gainsight objects in Tableau, and build reports on the customer success data.
Example Business Use Case: Admin wants to join Gainsight data with other data sources that are already available in Tableau.
IMPORTANT: Exporting any large object that takes a long time for the data to process is not possible with Gainsight-Tableau integration. To overcome this, it is recommended to export only the data that is required to create reports. Also, Gainsight encourages you to create smaller objects using Data Designer in case you need to export objects with a large amount of data.
Integrate Gainsight NXT with Tableau
To integrate a "Gainsight NXT" instance with Tableau:
- Open your Tableau Desktop account or Tableau Public edition.
- Navigate to Connect > To a Server.
- Select Web Data Connector. The Web Data Connector page appears.
- Paste this https://gateway.gainsightcloud.com/v1/public/tableau/wdc URL in the Enter your web data connector URL here text box.
- Press the Enter key. The Gainsight login page appears.
- Click Login with Gainsight.
- Type-in the Domain in the Enter Gainsight Domain text box.
- Click Next.
- Enter your Username and Password.
- Click Log In. The Tableau Data Source page appears.
Integrate Gainsight NXT in Salesforce with Tableau
Gainsight NXT in Salesforce CRMContent in this section supports Gainsight NXT accessing through Salesforce Login. To learn more about Gainsight NXT in Salesforce, click here.
- Click here to expand for more information on how to integrate a Gainsight NXT in Salesforce instance with Tableau
-
If a Salesforce connection is established in your org, you can integrate a "Gainsight NXT in Salesforce" instance with Tableau. To integrate:
-
Perform steps 1-5 from the Integrate Gainsight NXT with Tableau section.
-
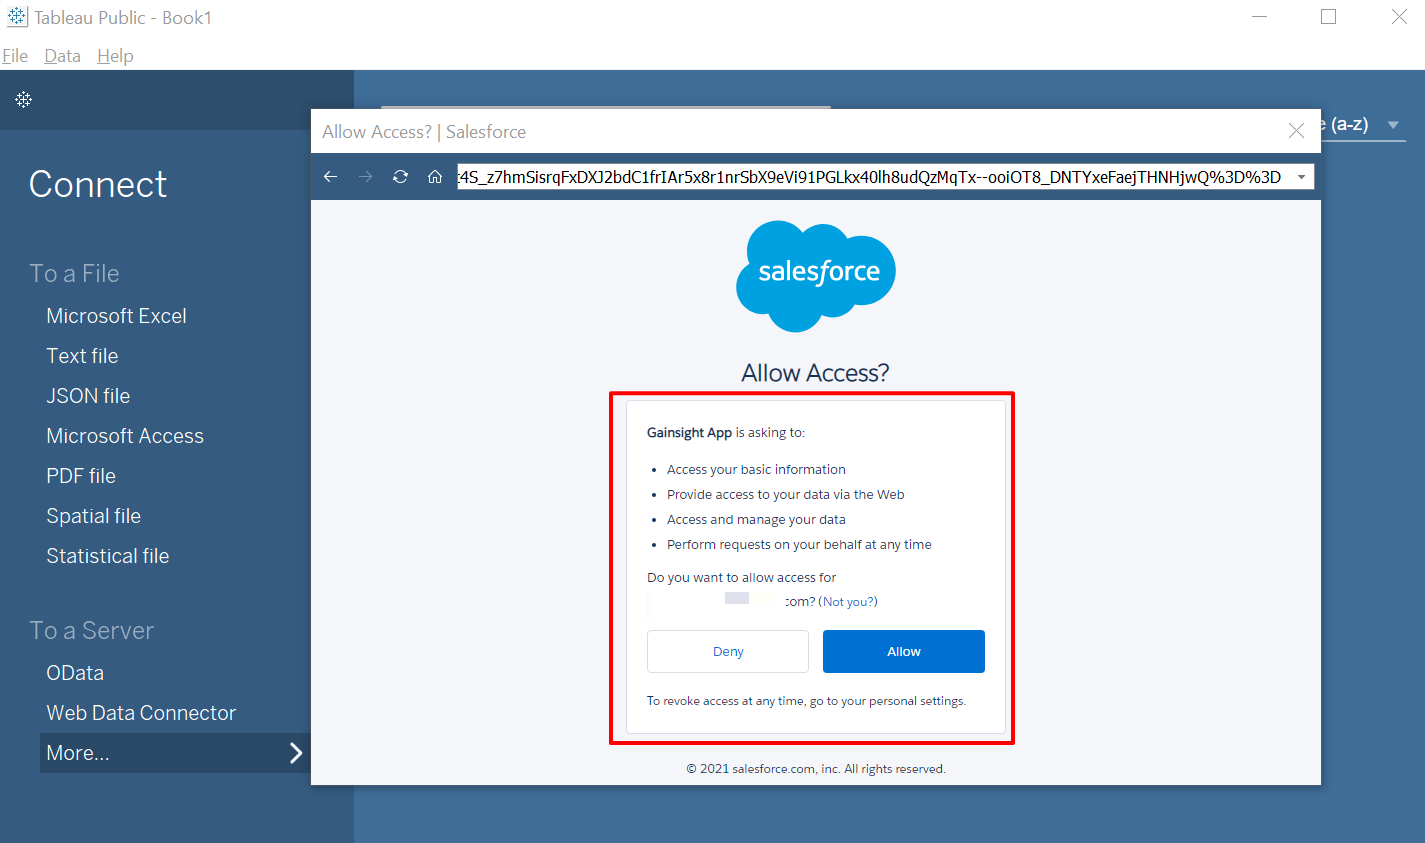
Click Login with Salesforce.
IMPORTANT: You can also Login to Salesforce by providing your Custom Domain name. If you have enabled SAML Authentication in your org, you will be navigated to the login page of SAML Authentication, and after your successful login, you automatically land on the Tableau Data Source page. -
Enter your Username and Password.
-
Click Log In. The Tableau Data Source page appears.
Note: If you are setting up this integration for the first time, you must allow the permissions shown in the following image.
-
-
Sections in Tableau
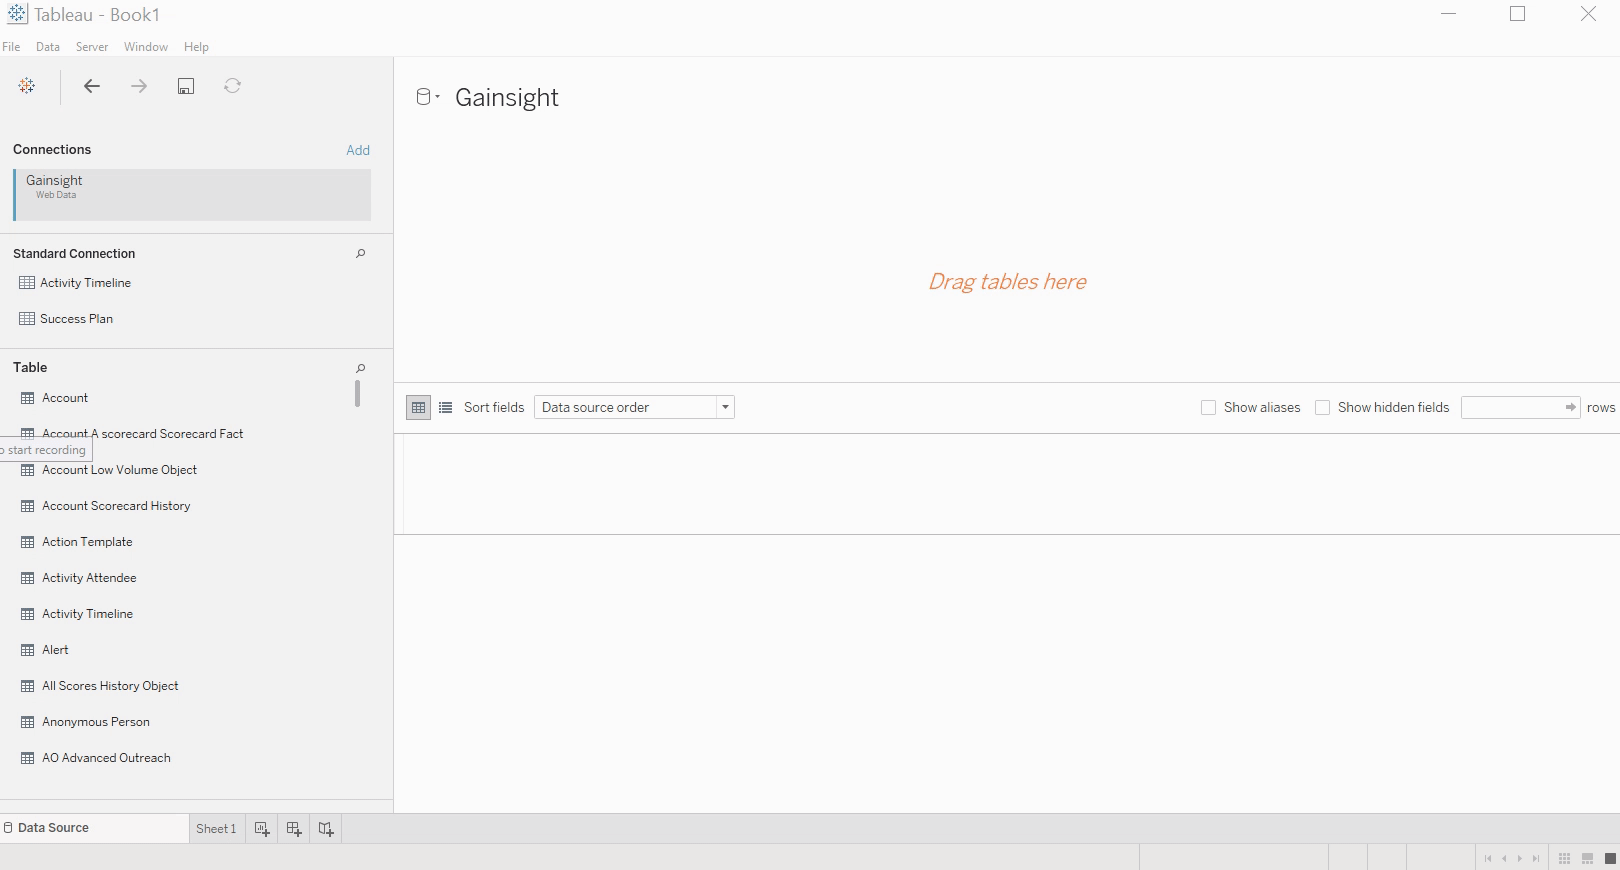
Once the integration is successful, you can see the following sections in Tableau.
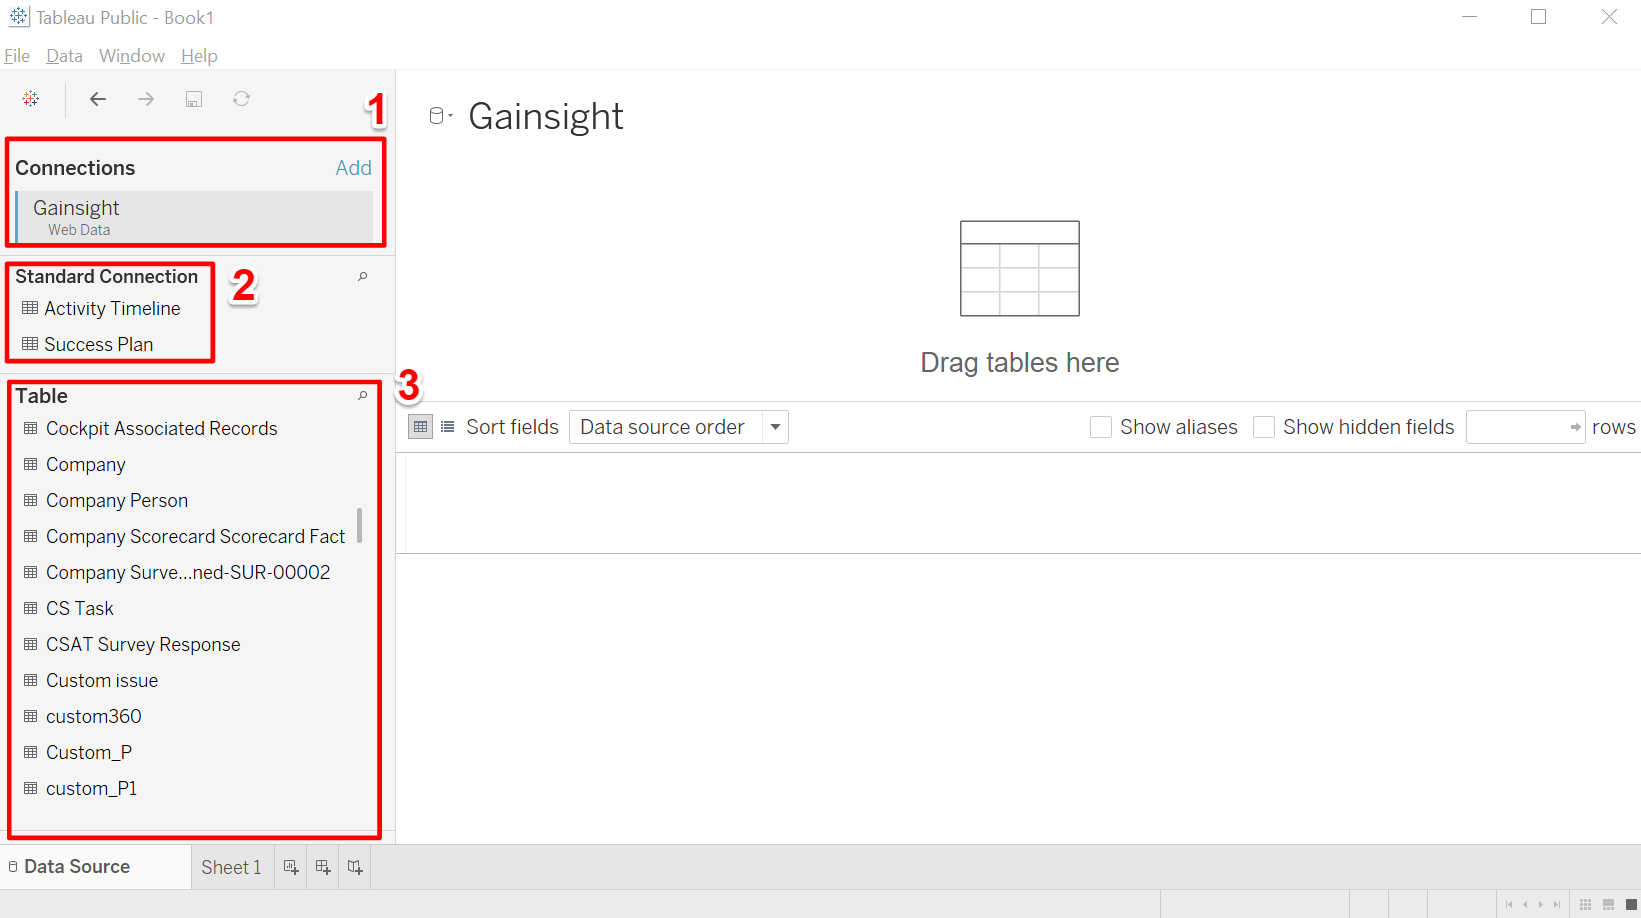
Note: The numbers in the below table represent the sections in Tableau.
| Sections | Description |
|---|---|
| 1 | Connections: This section displays the established Gainsight connection. You can rename the connection name if required. You can also edit the connection if you want to change it. |
| 2 | Standard Connection: This section displays the Gainsight application models Activity Timeline and Success Plans. These standard connections are prebuilt to address most of your reporting needs on those application models. These standard connections help reduce the user’s efforts in joining various objects. |
| 3 | Table: This section displays all the objects imported from Gainsight. Note: You can select the required objects and join the data to build reports based on your business requirements. For detailed information on joins, refer to the Join Your Data in Tableau article. |
IMPORTANT:
-
Standard Tables: You can see all the records for reports built on the User, Account, and Company tables. The reports built on other tables display records for only the last 180 days, provided you apply a filter on the CreateDate field.
-
Custom Tables: Reports created on these tables display records for the last 180 days, provided you already have a CreateDate field in the table and a filter is applied on it. If the custom table doesn't contain a CreateDate field, the report fetches 100K records only.
For information on how to build reports and dashboards using Tableau, refer to the Build a Basic View to Explore Your Data in Tableau article.
Create Sample Report in Tableau
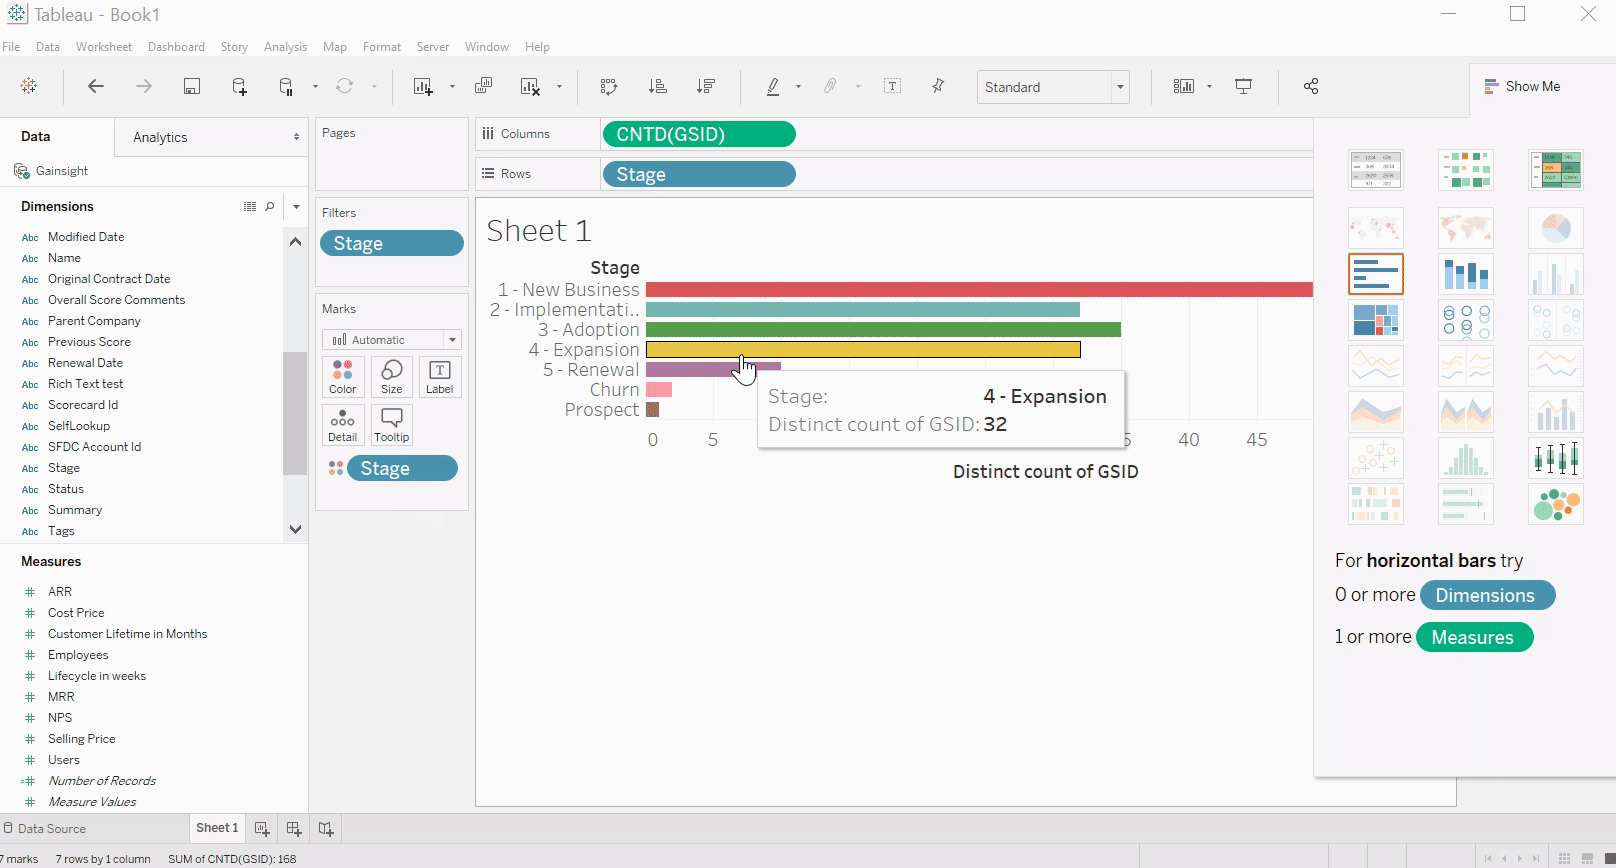
You can build reports on any Gainsight Objects and Application Models available under Tables and Standard Connection sections respectively. For instance, you might want to report on the Company object and see how many number of Companies are available in each Stage.
To create a sample report:
- From the Table list, drag and drop the required object to the Drag tables here screen. Here, the object is Company.
- Click Sheet 1.
- Drag and drop the GSID field to the Columns section.
- Drag and drop the Stage field to the Rows section.
- Change the aggregation of the GSID field to Count Distinct.
- Drag and drop the Stage field onto the Color button.
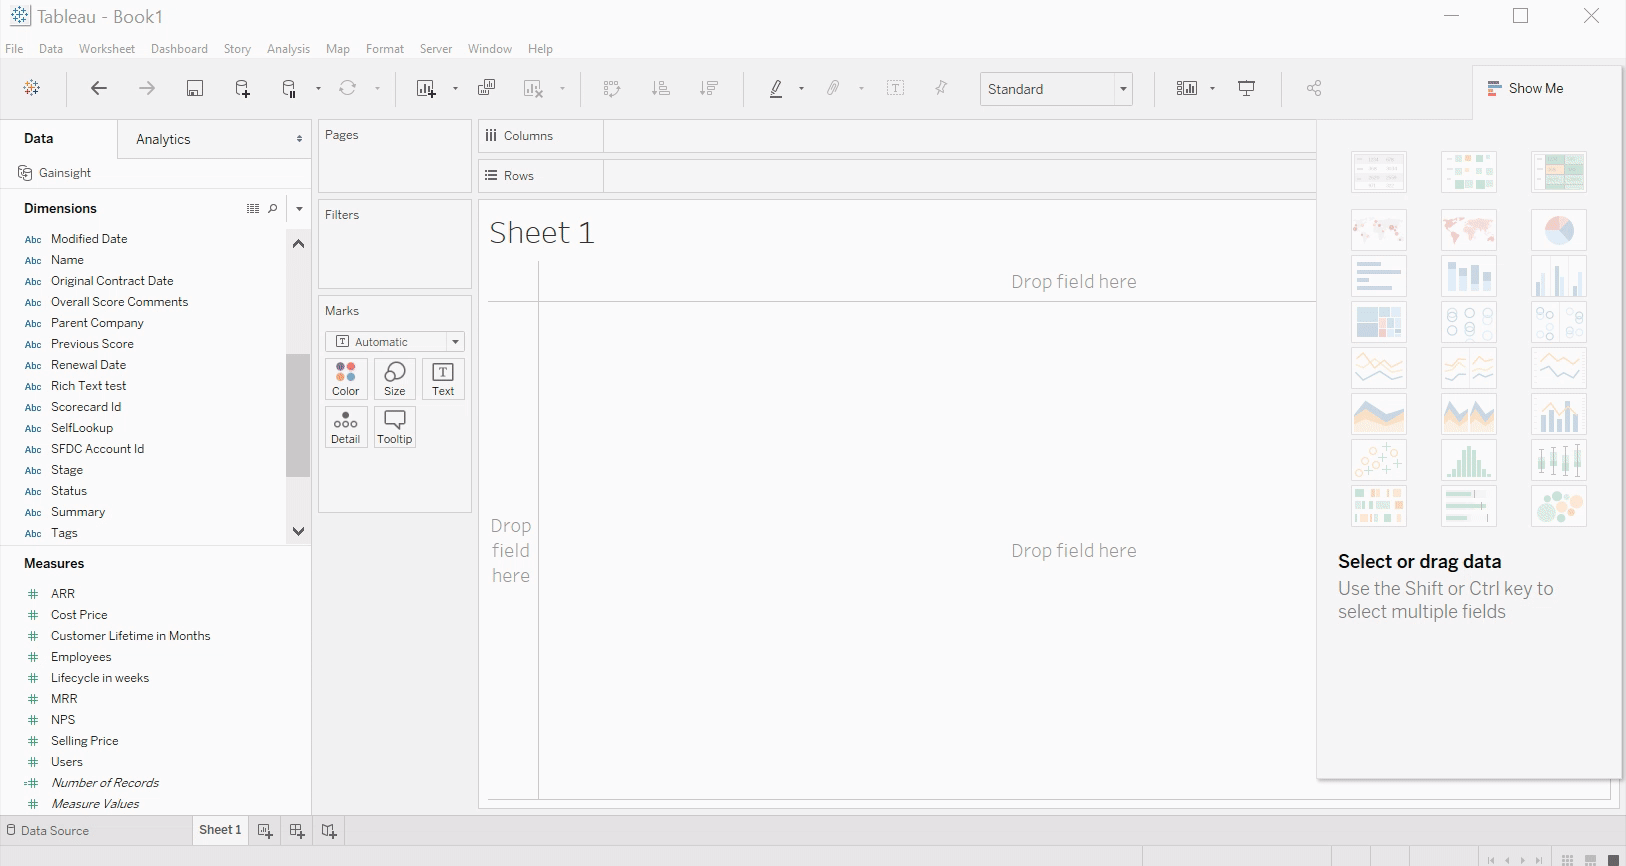
From the above report, you can view the number of Companies that are available in each Stage.