Configure Gainsight Home Dashboards (aka Layouts)
Gainsight NXT
Overview
This article explains about how to setup new Dashboards on the Gainsight Home tab. Gainsight Home allows you to display custom home pages with different sets of reports in a Dashboard, for different functions. For more information about how end users can use dashboards, refer to the Gainsight Home (Dashboards) Overview article.
Create Home Page Dashboard
To create a new Dashboard:
- Navigate to Administration > Analytics > Dashboard Builder. You will be landed on the Dashboard List View page.
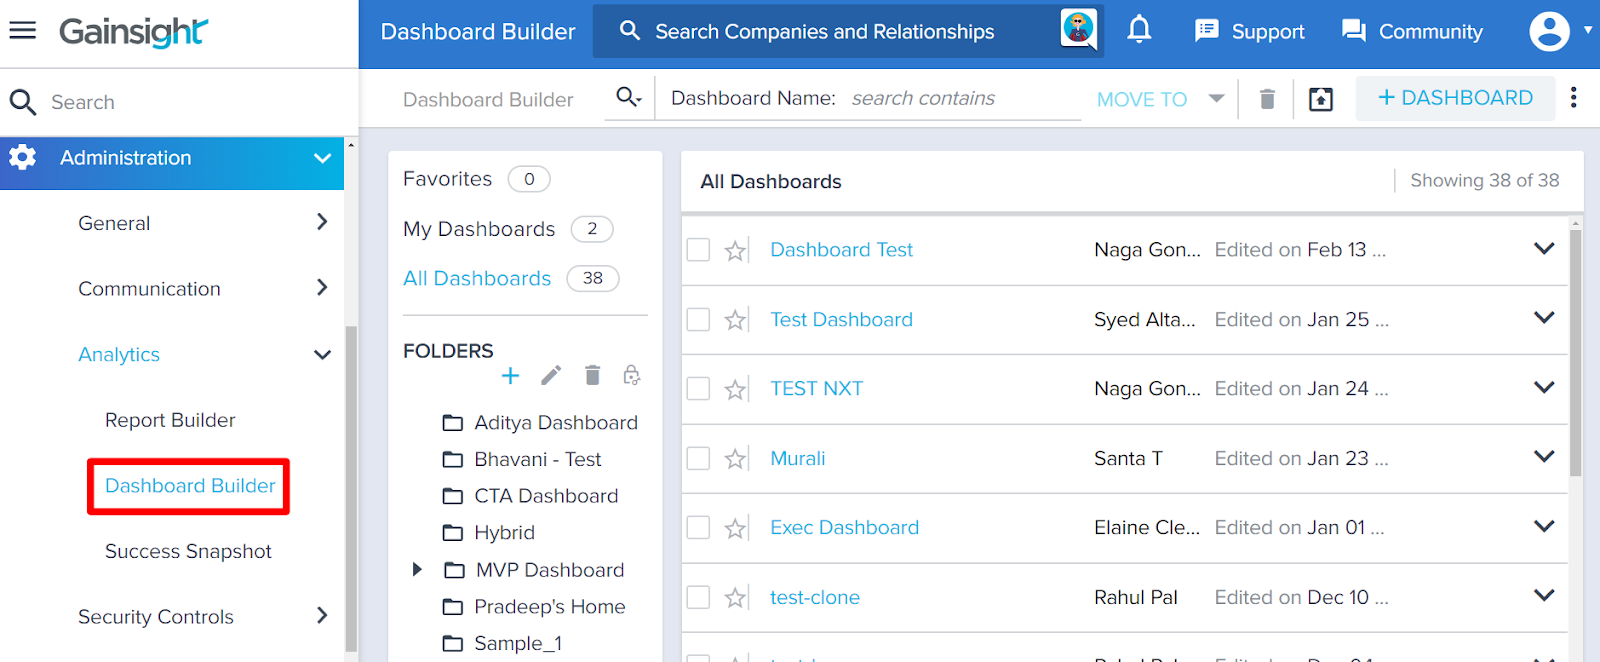
- Click on the existing dashboard to edit/duplicate a dashboard (or) click +DASHBOARD to create a new dashboard.
Note: When you Duplicate/Clone a dashboard, you will see all the global filters are also cloned to the new dashboard.
- Select a folder into which you want to save your dashboard (or click + under FOLDERS to create a New Folder).
- Enter your Dashboard Name.
- Enter the Description (optional).
- Click CREATE to save the dashboard.
- (Optional) Click Upload PPTX, to upload your corporate PowerPoint template. The PPT will be used if you choose to send dashboard reports via email to internal users. You can select an existing template from the list, or browse to a new template using the CHOOSE A FILE tab. If you don’t upload your own file, a blank template will be used to generate the dashboard attachment.

Dashboard Permissions
Admins can restrict a user/group of users from accessing a single or set of dashboards using the Dashboard Permissions. Admins can also provide limited access to the Report Builder and control the privacy of all new assets being created. The Dashboard Permissions is defined in such a way that end users must have the required permission to access data from Dashboards. For more information on this, refer to Dashboard Permissions article.
Configuring Dashboards
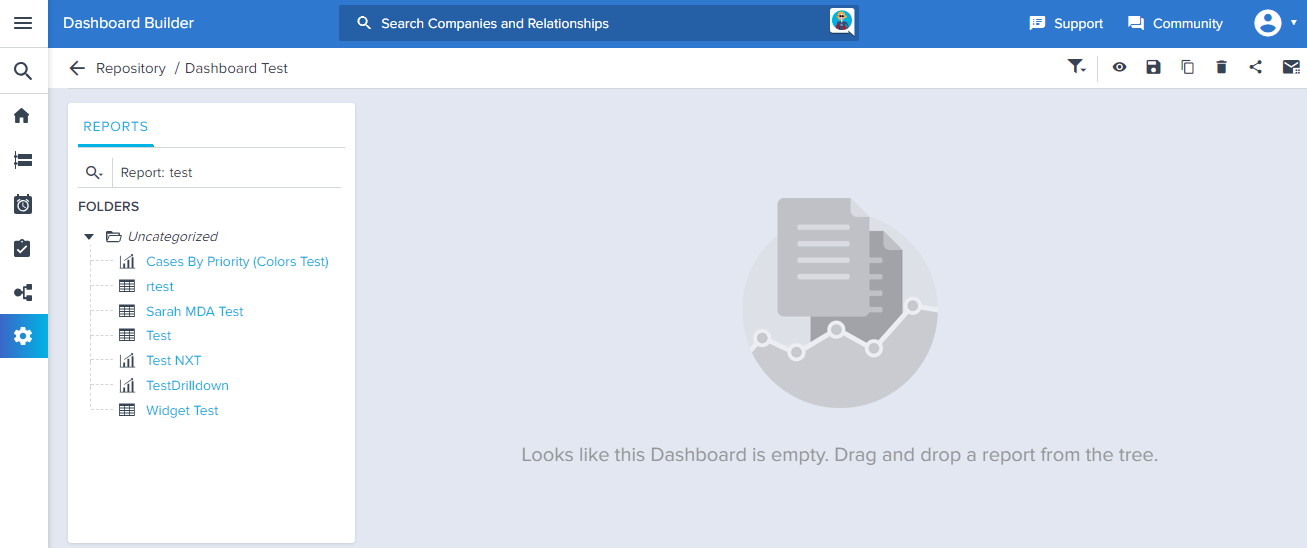
Configuring dashboards involves adding containers, resizing containers, and associating either a UI View or reports with containers. The dashboard editor consists of two sections: the left pane lists all available UI Views and reports by subject area, and the right side represents the layout designer, including the containers and the report associated with each container. You can add a maximum of 20 containers (i.e. reports).
Note: When building dashboards, Gainsight recommends browsers are not zoomed in or out as this can cause display issues.
Add, Resize, Reposition, and Delete Containers
To add, resize, reposition and delete containers:
- Drag and Drop a report from the tree to add a container. You can add a maximum of 20 containers to a layout.
- Hold and Drag the container from the bottom right corner to adjust the width and height of a container. To modify the position of a container, click and Hold anywhere of the container and drag it.
- Click the delete/trash icon at the top right corner of a container to delete a container.
Associate Reports with a Container
To associate reports with a container:
- Drag and drop a report name from the list of available UI views/reports (on the left) on to a container. After dragging a report to a container, the metadata about the associated report will be shown in the appropriate container.
Note: When you create a dashboard and make modifications to the associated reports, the changes may not be reflected even after you refresh the page or logout and login back. This is due to User State Preservation, to resolve this, remove and re-add the container and its report, and re-save the dashboard.
To learn more on how User State Preservation works with Dashboards, refer to How User State Preservation works with Dashboards article.
If a UI View is dragged onto a container, an empty table representing the columns in the associated UI views will be shown on the container.
Associate Reports created on Salesforce Objects with a Container
Gainsight NXT in Salesforce CRMContent in this section supports Gainsight NXT accessing through Salesforce Login. To learn more about Gainsight NXT in Salesforce, click here.
- Click here to expand for more information on how to associate reports created on Salesforce Objects with a container
-
You can create reports on Salesforce objects, only when a Salesforce connection is established in your org. After a report is created, you can then add it to a container. The reports you can add to a container depends on your login method:
- When you login to Gainsight NXT via Salesforce, you can see all of the reports created on Salesforce objects, and can add those reports to a container.
Note: You can also add reports created on Salesforce objects and Gainsight objects to different containers in a single Dashboard.
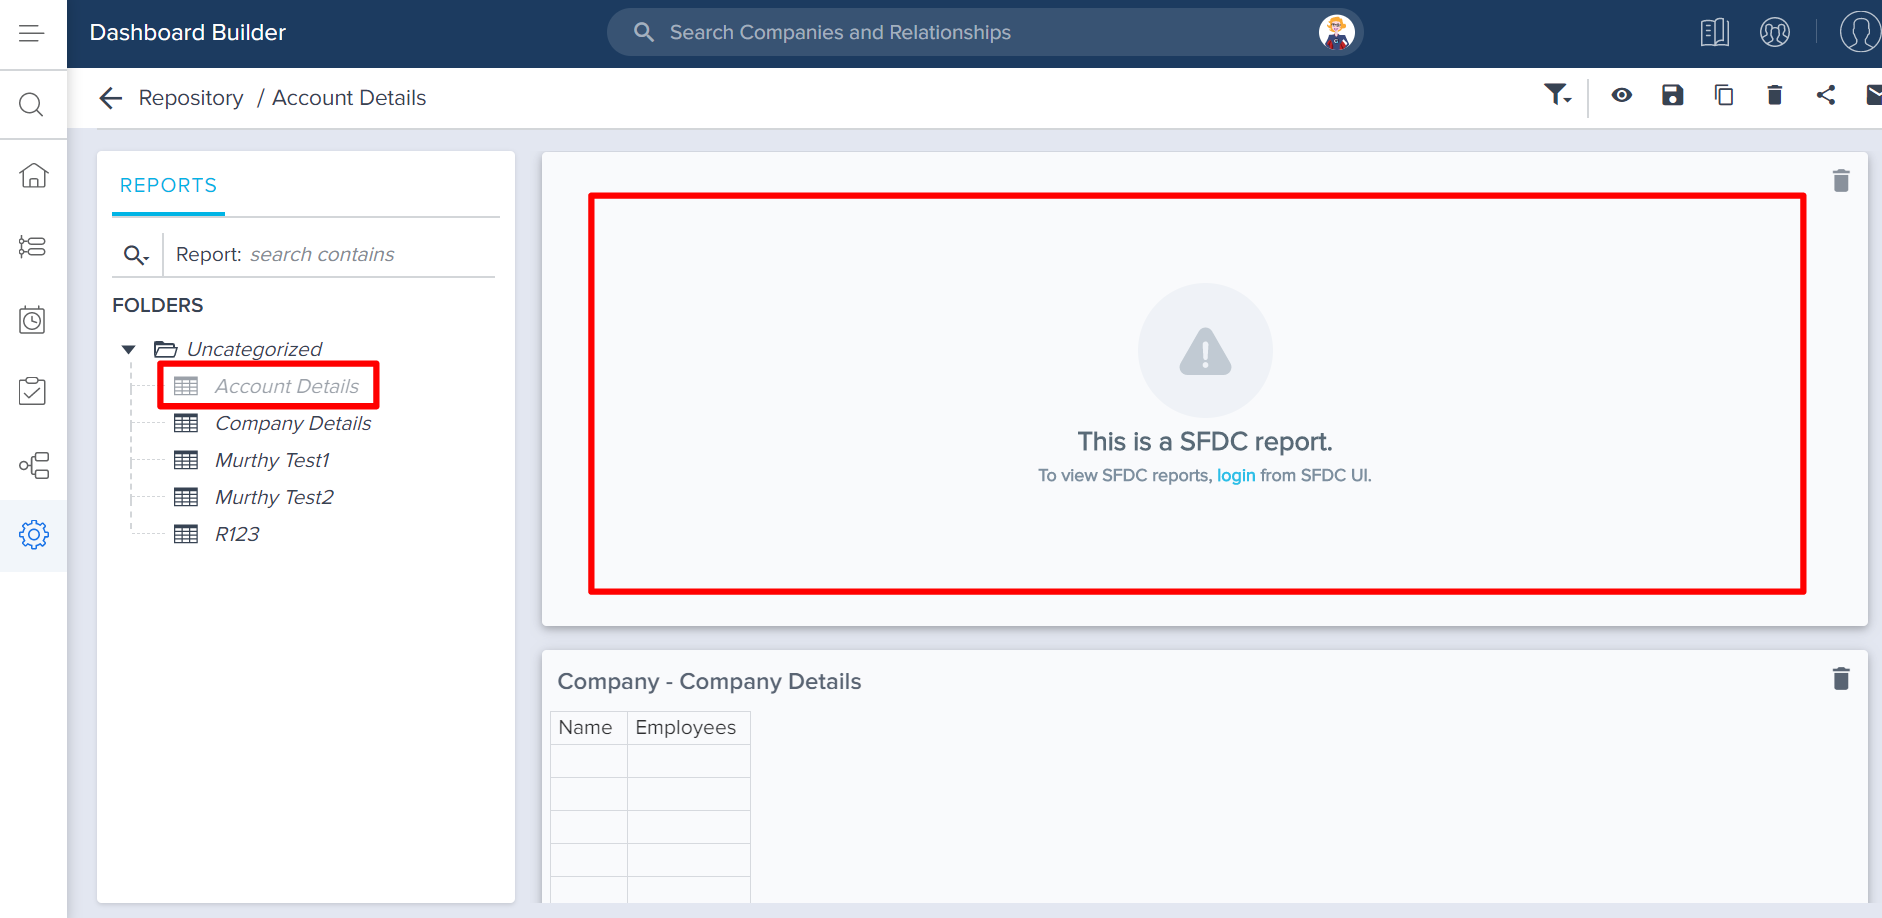
- When you login to Gainsight NXT directly, you can only see the report names of the reports created on Salesforce objects, and cannot add those reports to a container.
- If you have already added a report created on Salesforce object to a Dashboard, and then logged-in to Gainsight NXT directly, you will see the following message.
Global Filters for Dashboard
Admins can set up global dashboard filters for using them on the Gainsight tab. In order to setup a dashboard level filter, every report in a dashboard must be built in Report Builder. These filters can be applied to one or more reports on a dashboard. The reports can be built on different objects. This functionality reduces the number of filters required on each report on a dashboard, which in-turn reduces the number of dashboards required for each team, member, or reason. For more information about Global Filters, refer to Global Filter for Dashboards article.
Updating Report Filters on Existing Dashboard Reports
If you make changes to a report's filters and the report already exists in a dashboard, the filter changes will not automatically appear in the dashboard. This is due to 'User State Preservation,' which is designed to have multiple users have their own state of the filter. To learn more on how User State Preservation works with Report Filters, refer to How User State Preservation works with Dashboards article.
Currently, the only way to update the individual report filters in the dashboard for everyone, is to remove the relevant report and its container from the dashboard, and then add it back to the dashboard.
Organize Dashboards into Folders
Dashboards can be organized into folders on the Dashboard Builder page. By default, folders are sorted alphabetically at each level and existing dashboards are stored in the Uncategorized folder. To organize dashboards into folders, perform the following steps:
- Navigate to Administration > Analytics > Dashboard Builder.
- Click the + icon on the left menu. The Add Folder pane is displayed.
- Select the folder structure where you want the new folder to be added.
Note: All new folders will reside inside Home, which is the root folder. - Enter a name in the Folder Name field.
- Click ADD. The required folder is added.
- To edit the name of a folder, click the edit icon after selecting the folder.
.gif?revision=1)
- To delete a folder, select the folder and click the delete icon.
Note: If the folder contains a subfolder or dashboard inside it, the system displays a message specifying that the folder cannot be deleted.
You can perform the following actions once the folders are created:
- Move a dashboard into a folder (drag and drop, or use the MOVE TO menu).
- Drag and drop a folder into another folder.
- Mark individual dashboards as Favorites at the user level.
- Create a dashboard and add it to a specific folder.
Note: All Dashboards displays the total number of dashboards available under different folders, and My Dashboards displays the dashboards that you have created. - You cannot create sub-folders (nested folders) at third level. Only two levels of subfolders are allowed under Home.
- You can move only the dashboards for which you have the access or you are the admin. If you do not have the permission, the checkbox, MOVE TO field, Delete icon, and the permission icon will be disabled. You may mark them as favorite by clicking
 .
.
Note: Only 50 dashboards at a time may be moved from one folder to another.
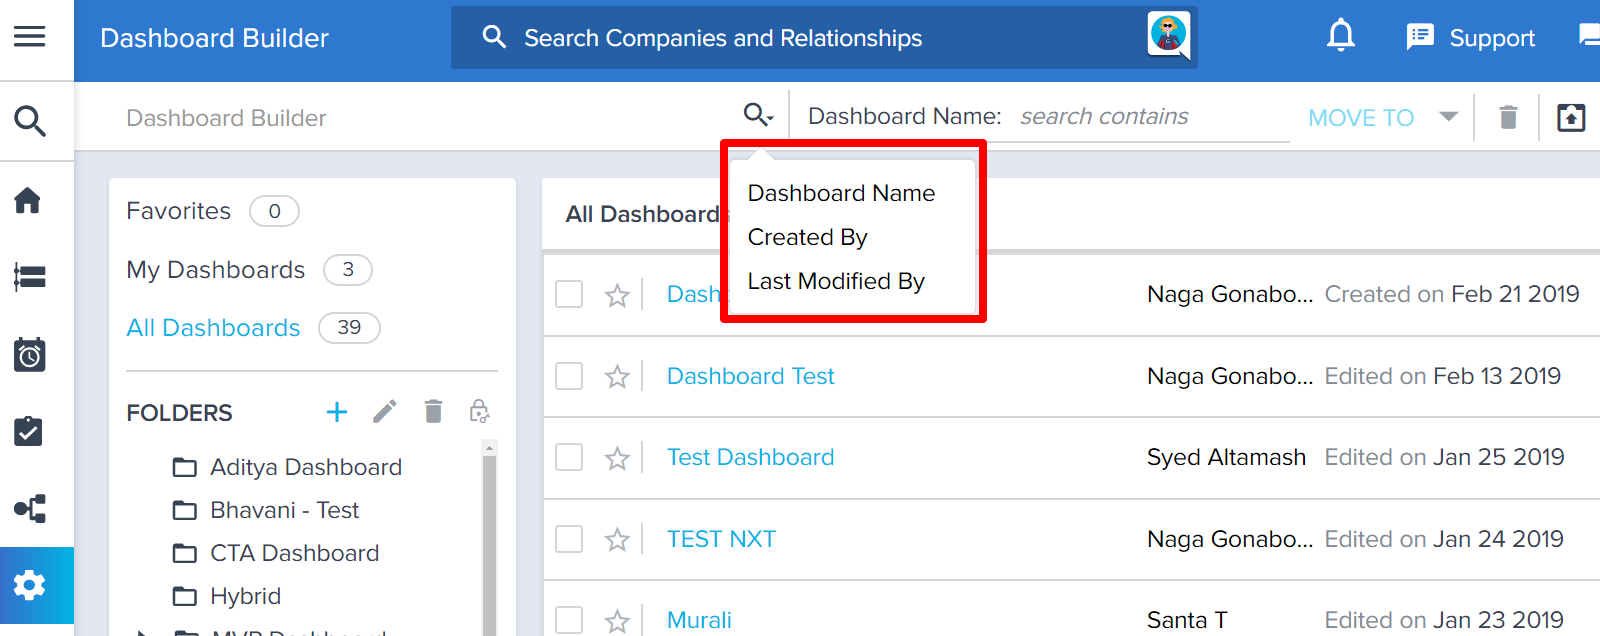
Search Dashboards
You can also search for existing dashboards by typing in the search pane.
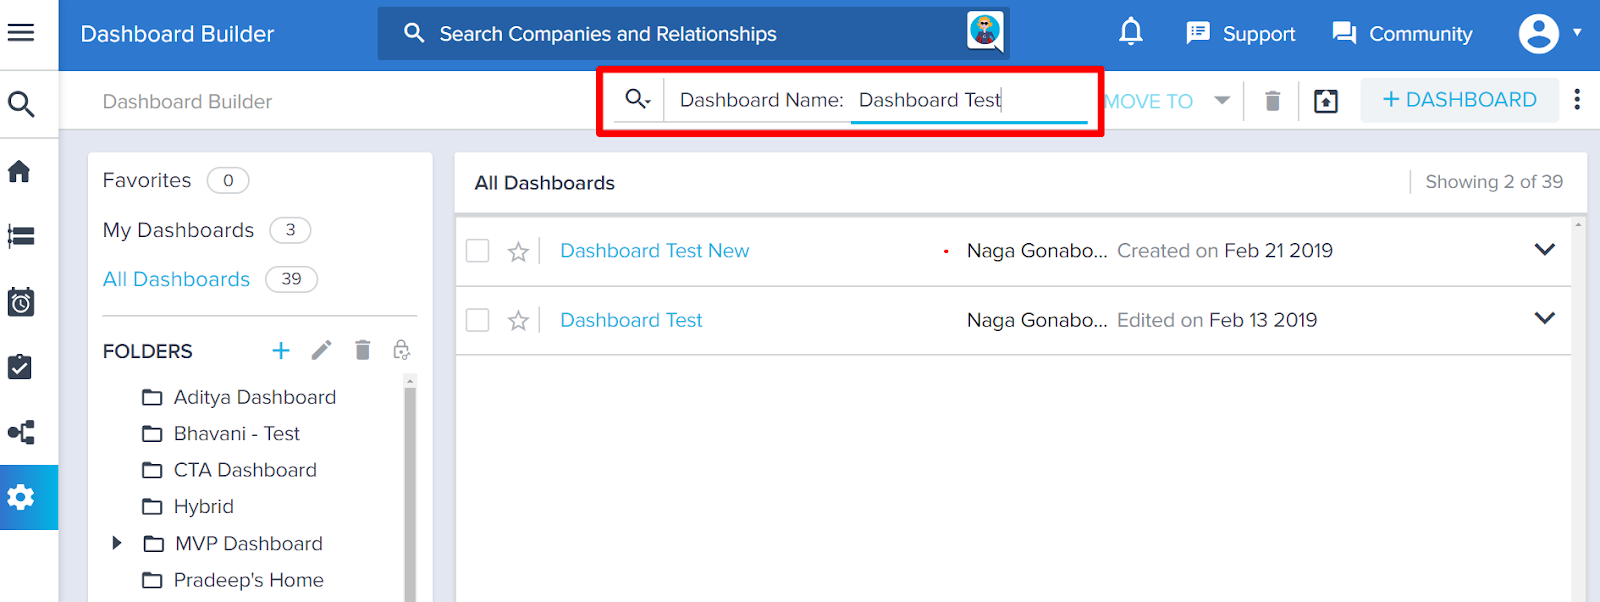
You can search for dashboards by Dashboard Name, Created By and Last Modified By.
How to Email Dashboards to Users
If you check your Gainsight dashboard(s) frequently, or if you want to send the dashboard to your colleagues and managers, we recommend using Gainsight’s Email Dashboard functionality. This functionality helps you send a dashboard as a PowerPoint presentation, attached in an email, on a specific schedule. (End users can also send internal Gainsight users dashboards via email from the Gainsight Home tab. For more information on this, refer to Gainsight Home (Dashboards) Overview article.
To email dashboards to users:
- Navigate to Administration > Analytics > Dashboard Builder.
- (Optional) Click Upload PPTX, to upload your corporate PowerPoint template. The PPT will be used if you choose to send dashboard reports via email to internal users. You can select an existing template from the list, or browse to a new template using the CHOOSE A FILE tab. If you don’t upload your own file, a blank template will be used to generate the dashboard attachment.
Limitations:
- When sending dashboards via email, packed bubble reports, Scorecard Mass Edit and the Scorecard UI View are not currently supported.
- To view the dashboard email schedule, or to see if a dashboard contains a schedule, you must click the email icon for the individual dashboards/layouts.
- Dashboards with filters for the CSM or current user (for example) will not automatically send only the current user's data.
- Hover on the relevant dashboard and click Edit Layout (pencil icon).
- Click the Email as PPT icon in the top right corner.
- In the Email Dashboard as PowerPoint window, enter the following details:
- Add Recipient: The email address(es) of the email recipients.
- Email Subject (required): The subject of the email.
- Email Body (optional): The body of the email.
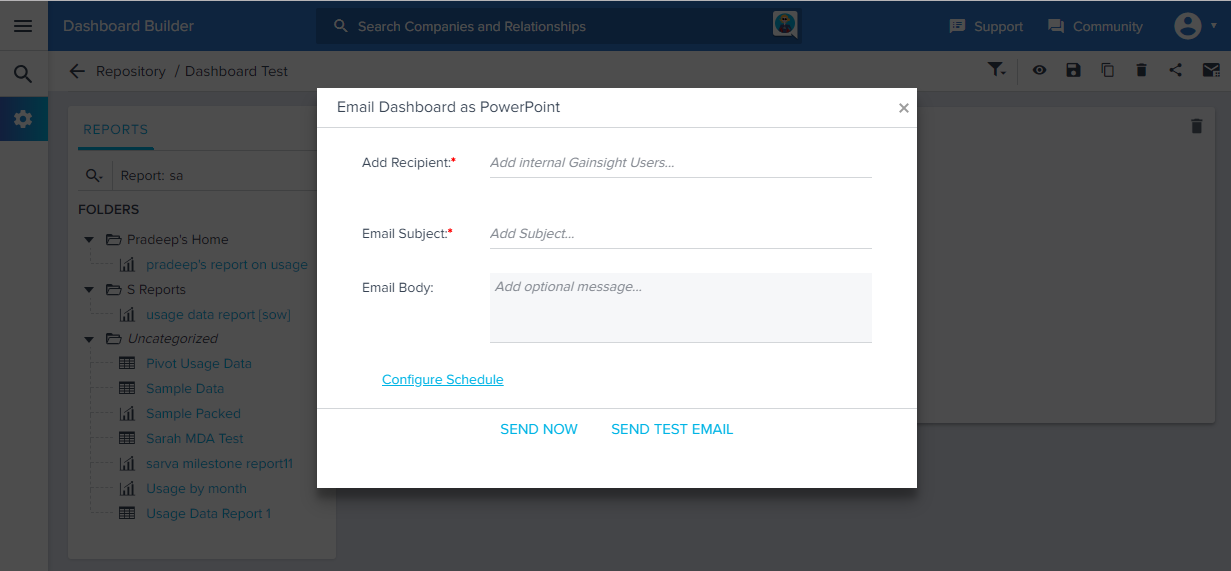
- Click Configure Schedule if you want to schedule sending the dashboard via email and set time, frequency and duration.
- Click SAVE or SEND TEST EMAIL.
Note: The schedule gets saved and triggers at the appropriate time. Recipients receive the desired dashboard attached as a PowerPoint presentation in an email. Each report appears on a separate slide, except for tables which may span multiple slides.
- Click SEND NOW or SEND TEST EMAIL. Use Send Test Email to preview the Email Dashboard. The test email will send to the user who is logged in.
Note: If you select Configure Schedule, you will not be able to see the SEND NOW option.
How to Delete a Recipient from a Dashboard Email Schedule
To remove one or more recipients from the Dashboard email schedule, use the X next to their email address, and click SAVE. At least one recipient must be included in order to maintain a schedule.

How to Delete a Dashboard Email Schedule
To delete the schedule completely, click DELETE SCHEDULE, at the bottom of the Email Dashboard Settings window. A confirmation message will display.