Dashboard List View and Settings
Gainsight NXT
This article explains to admins how to use the options available in the Dashboard List and Settings pages
Overview
The Dashboard Builder feature is categorized into two pages, the Dashboard List and Settings pages. The Dashboard List view page contains all the existing dashboards, folders, and list view options including the ability to create new dashboards. The Settings page has options to enable or disable lazy loading of widgets and Adoption Explorer widget settings.
To access Dashboard Builder, navigate to Administration > Dashboard Builder.
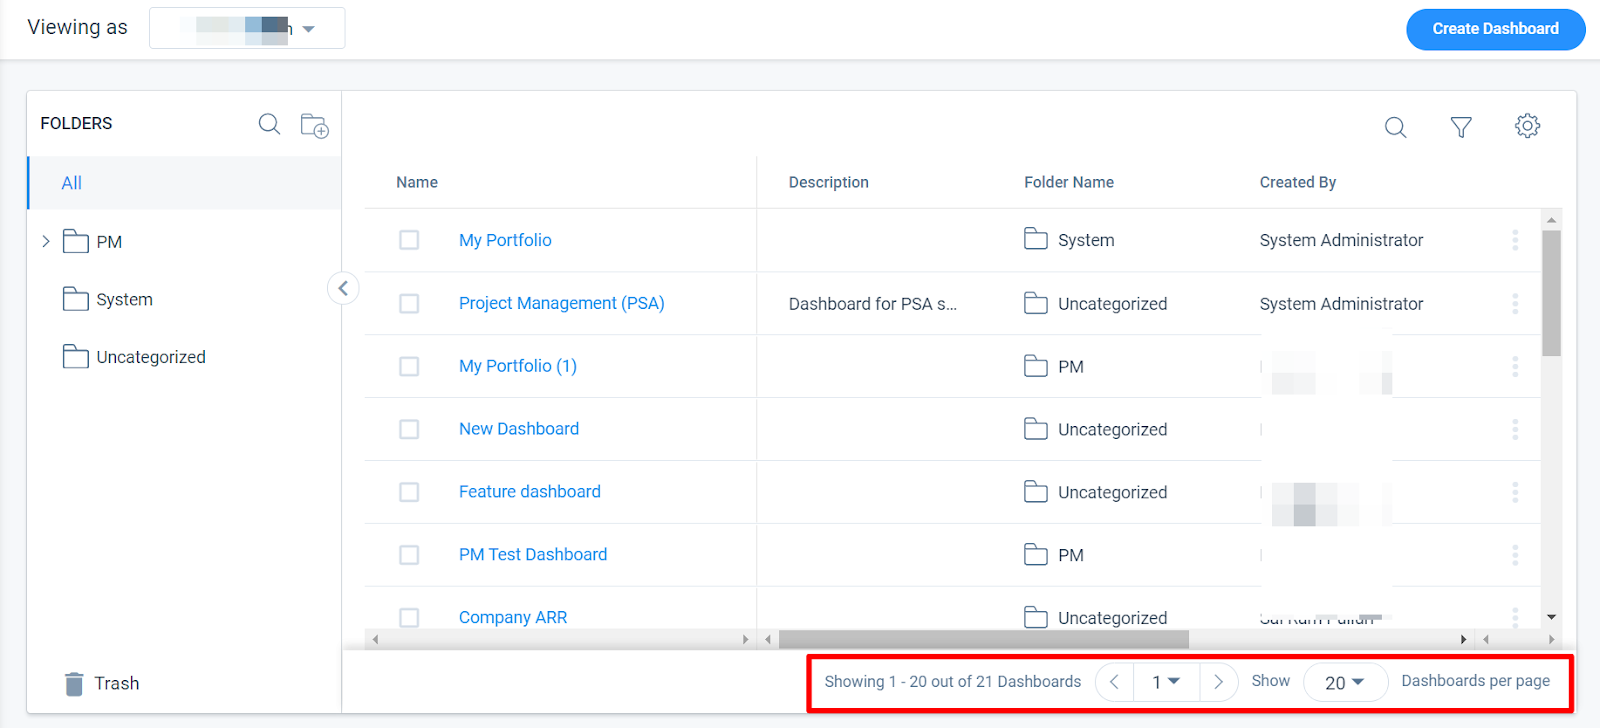
Dashboard List Options
The Dashboard List page is categorized into three sections:
- Folders and Options
- Dashboard List View and Options
- Pagination
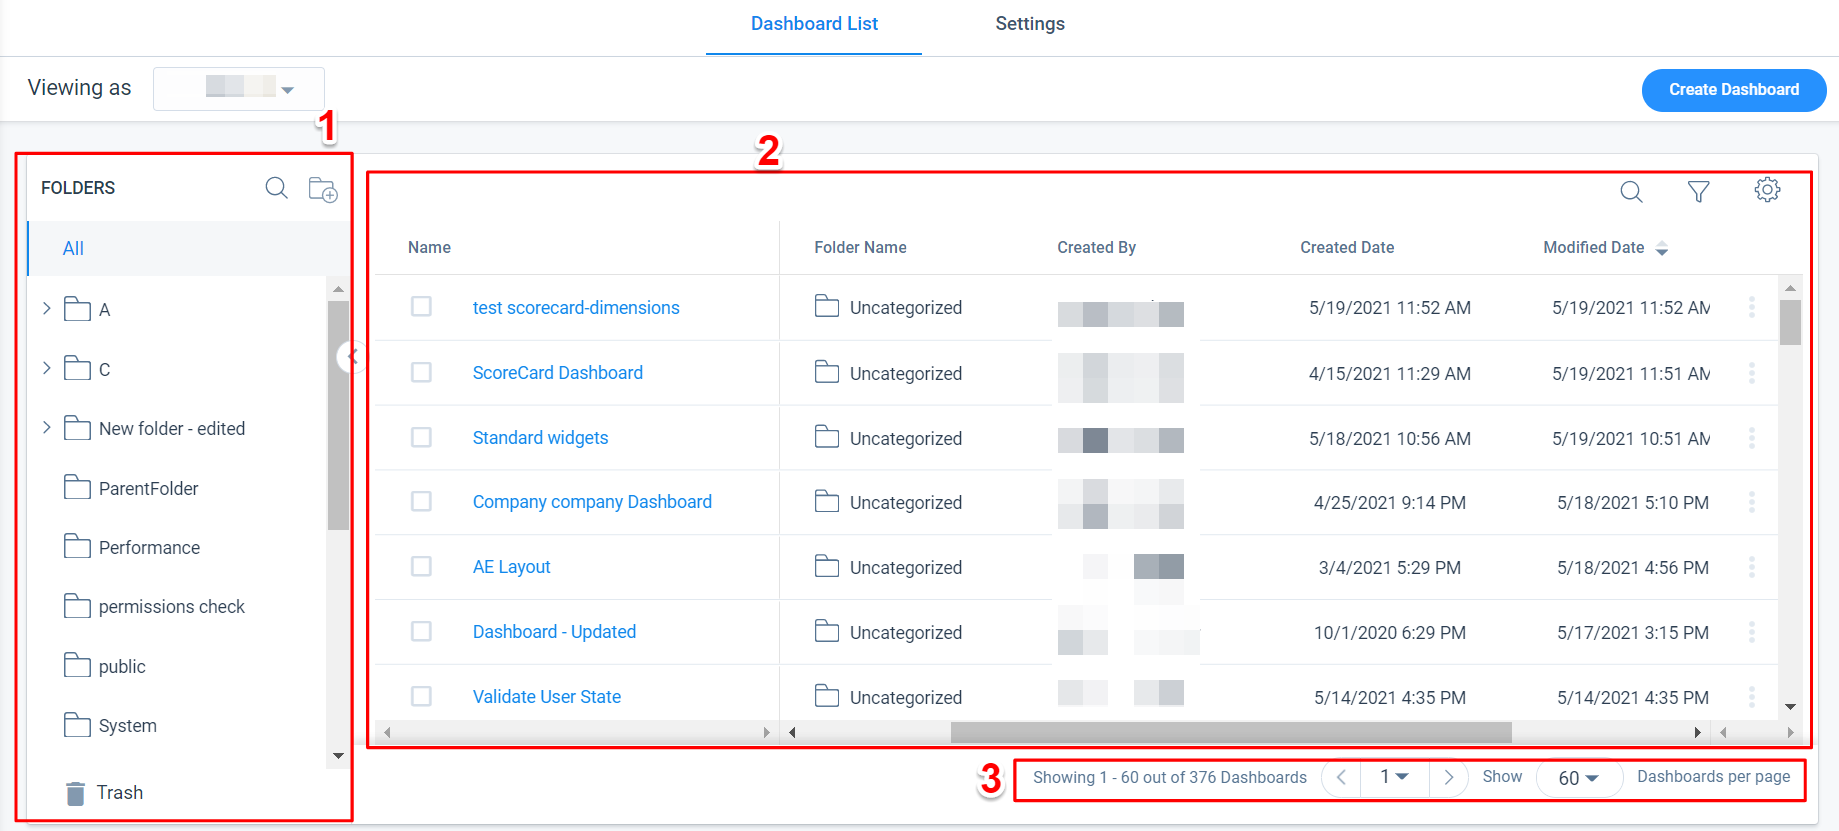
List View and Options
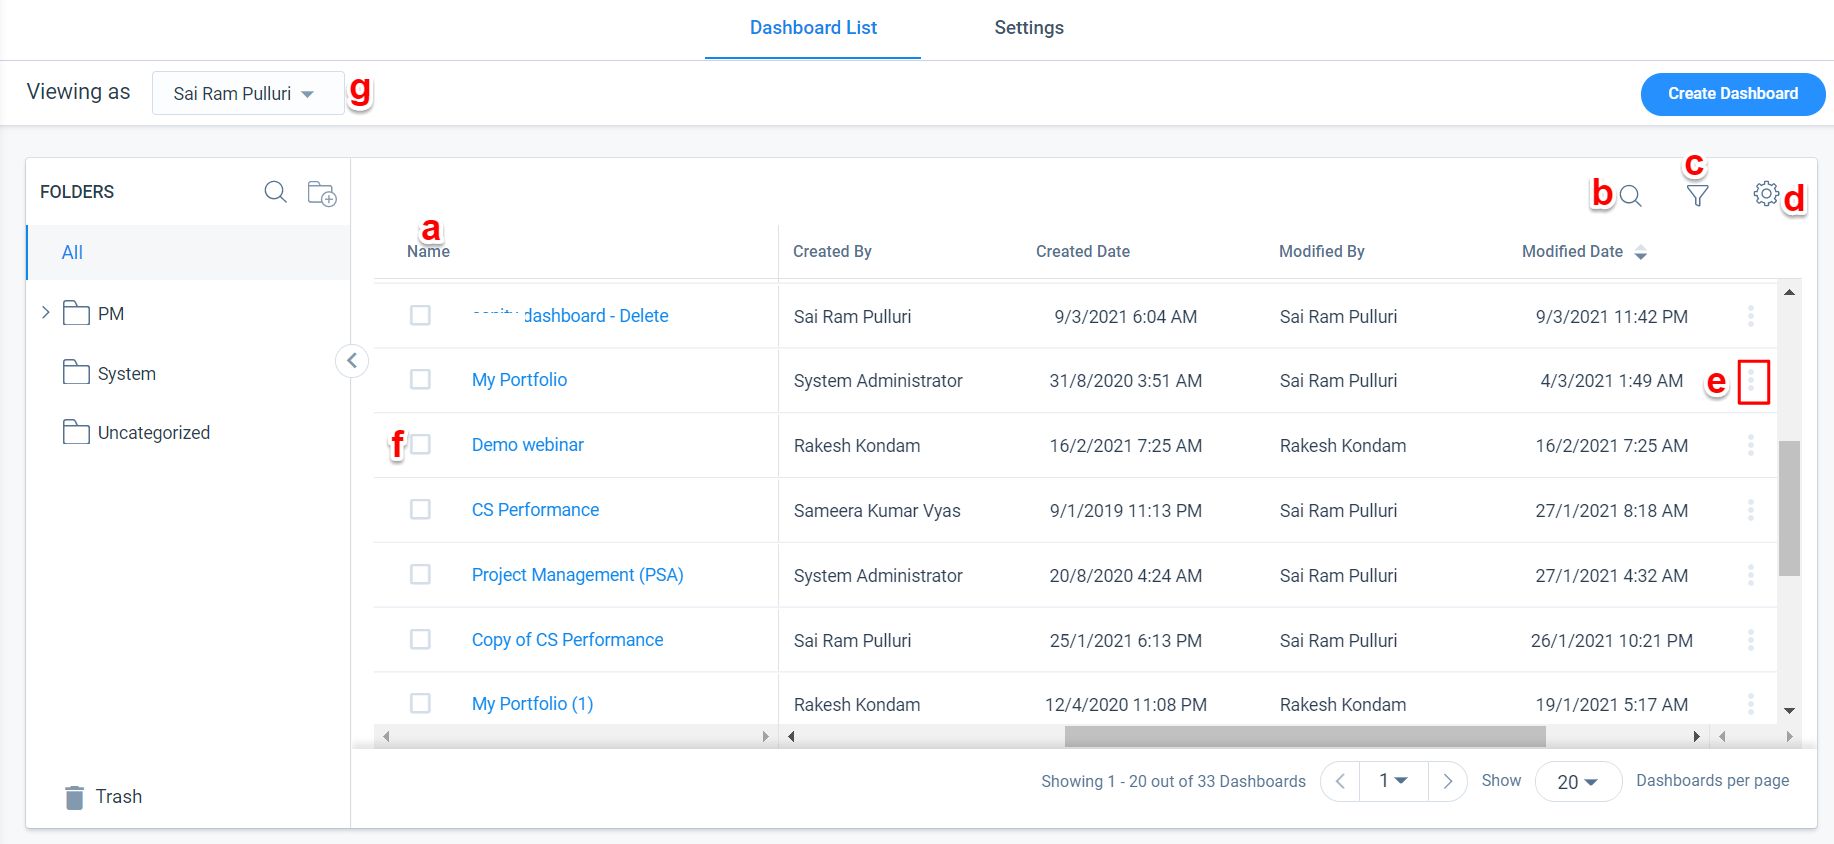
The Dashboard List page displays all the existing dashboards from every folder. The following options are available on the Dashboard List page:
-
Name: The Name field displays the names of every dashboard from every folder. This is a default category in the Dashboard List pane.
- Search: Enter text to search the dashboard list by Name.
- Filter: Click to apply filters to the dashboard list with criteria based on the Created By and Modified By fields. Applied filters narrow down search results within the list.
To apply filters:-
Click the Filter icon. The Filters page appears.
-
Click Add Filter.
-
From the Field dropdown list, select either Created By or Modified By as required.
-
From the Operator dropdown list, select either equals or not equals.
-
From the Select User dropdown list, select either Current User, All Users, or Other User.
Note: When you select Other User, the User search box is enabled. Enter the relevant user name. -
Click the + icon to add multiple filters.
-
Click the x icon to delete filters.
-
Click Clear to clear all added filters.
- Click Apply to filter the dashboard list based on the added criteria.
-
- Settings: Click the Settings/Gear icon to customize the Dashboard List View. You can search, select single or multiple fields, and click Apply to add them to the Dashboard List page.
You can select the following fields under the Settings option as viewing criteria for the Dashboard:-
Name: Displays the name of the Dashboard. This field is selected by default and cannot be deselected.
-
Description: Displays the description text entered when the Dashboard was created.
-
Folder Name: Displays the respective folder name under which the Dashboard is saved.
-
Created By: Displays the name of the User who created the Dashboard.
-
Created Date: Displays the date when the Dashboard was created.
-
Modified By: Displays the name of the last User who modified the Dashboard.
-
Modified Date: Displays the date the Dashboard was last modified.
- Report(s): Displays the total number of reports added to a specific Dashboard.
-
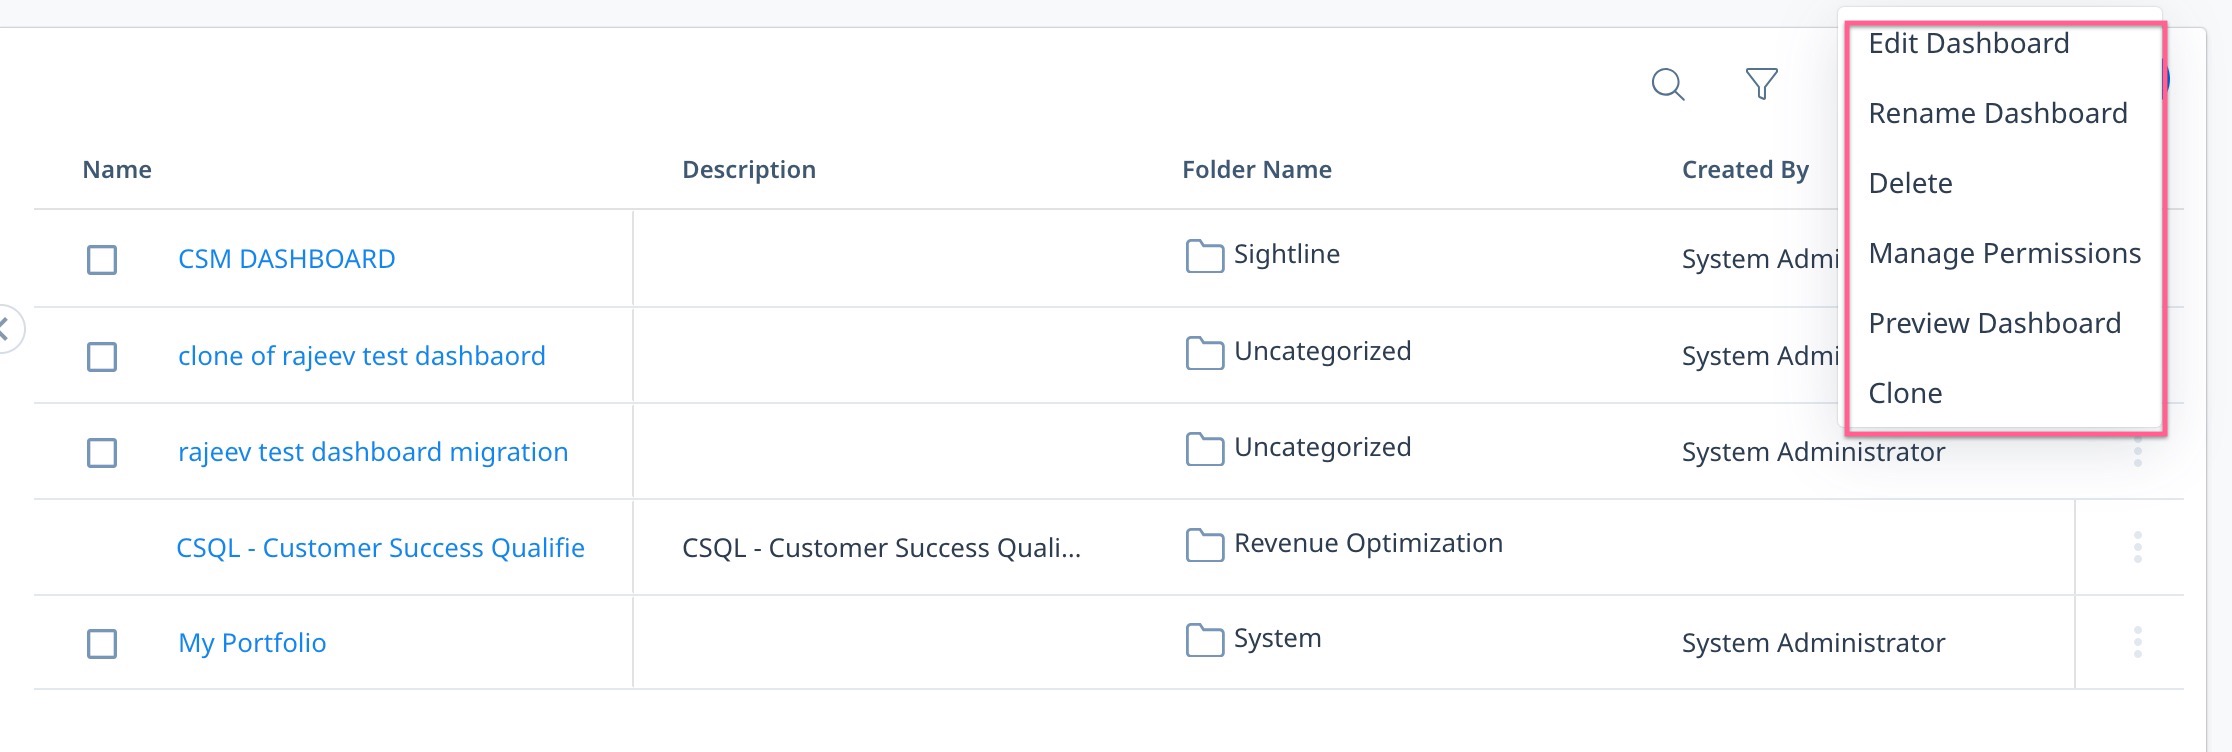
- Context Menu: Click the Context menu on any Dashboard to view the following options:
-
Edit Dashboard: Click to edit the selected Dashboard.
-
Rename Dashboard: Click to rename the Dashboard and provide a description (optional).
-
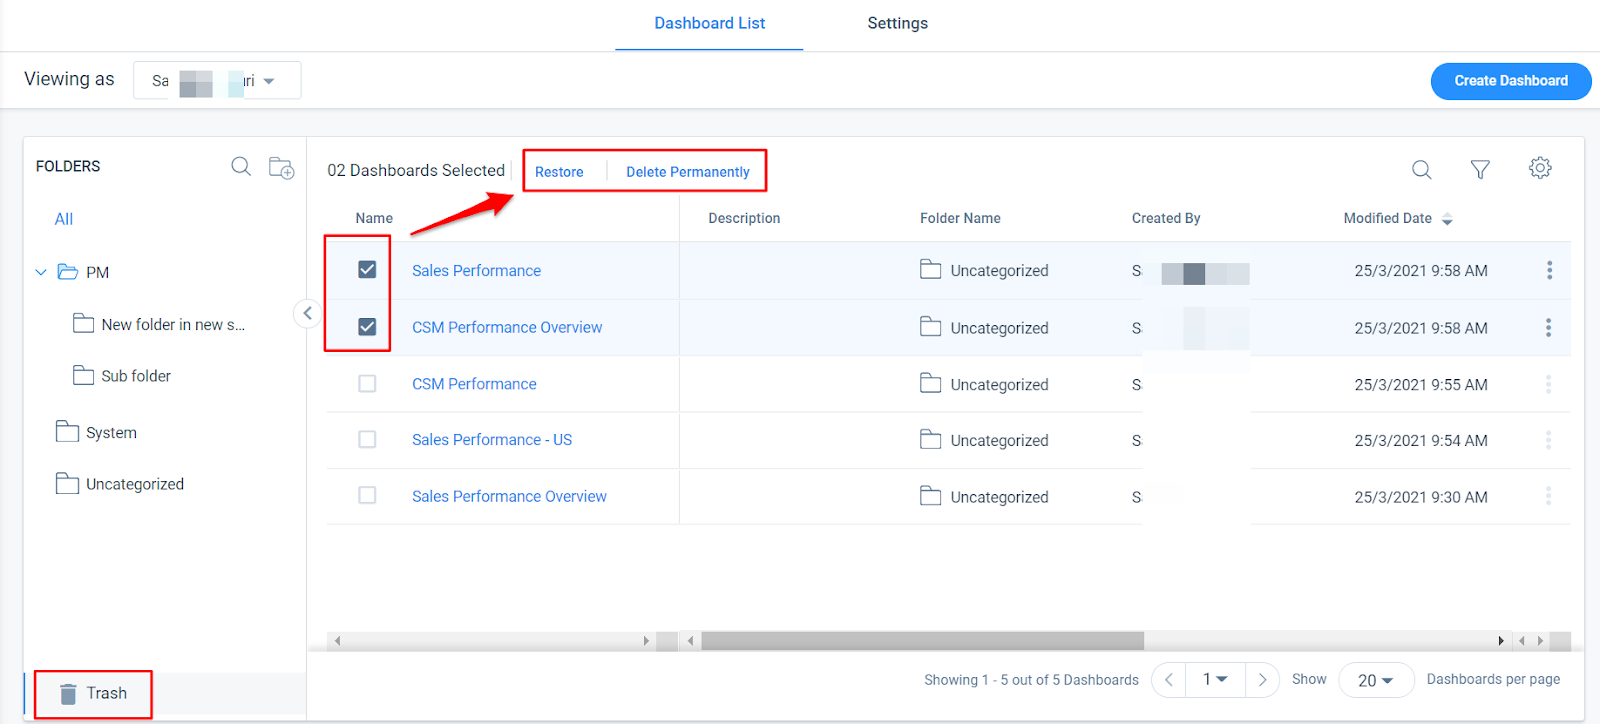
Delete: Click to delete the selected Dashboard. The deleted Dashboard is moved to the Trash folder.
-
Manage Permissions: Click to assign permissions for Dashboards and Folders. For more information, refer to the Dashboard Permissions article in the Additional Resources section at the end of this article.
-
Preview Dashboard: Click to view the Dashboard in different resolution options such as Tablet, Laptop, and Monitor.
-
Clone Dashboard: Click to clone the Dashboard and modify it based on the requirements.
-
-
Checkbox: Select the checkbox next to the Dashboard name to Move or Delete it. You can click multiple Dashboards to take actions on all of them.
- Viewing as: Click to display the name of the Current User. Access to the Viewing as option is restricted based on user permissions. For more information on how to assign permissions, refer to the Dashboard Permissions article in the Additional Resources section at the end of this article.
Note: You can sort and rearrange columns as required, except the Name column.
Folders and Options
Folders manage and organize all the Dashboards created in your org. By default, you can see All and Uncategorized folders. You can create folders and subfolders under All, as well as edit and delete folders and subfolders. If a dashboard is not categorized or moved to a specific folder, the dashboard remains Uncategorized.
Create Folder
To create Folders:
-
Click the Add new folder icon. The Add Folder window appears.
-
In the Folder Name text box, provide the Folder Name as required.
-
Select the Parent Folder from the displayed list of folders. Select Home to create a new Folder. You can also select an existing folder if you want to create a Sub-folder under it.
- Click SAVE.
Edit/Delete/Manage Folders
To Edit, Delete, or Manage folders:
-
Click the Folder Name you wish to edit or delete.
-
Click the Pencil icon to edit the folder name, and click ✓.
-
Click the Delete/Trash icon to delete the folder.
-
Click the Lock (permission) icon to set permissions to folders. For more information on how to manage permissions, refer to the Dashboard Permissions article in the Additional Resources section at the end of this article.
Notes:
-
Folders cannot be created under the Uncategorized category.
-
Only 2 (Base + 1) levels of subfolders can be created under Home.
-
You can drag and drop a folder (that has no subfolders) into another folder.
-
You can see all folders in sublevels by expanding or collapsing the folder section.
-
Enter text in the Search box to search for folders based on Name.
-
Folders containing dashboard(s) cannot be deleted.
-
Admins or users with access to Dashboards can move the dashboards. If you do not have the required permissions, the Checkbox, Move to field, Delete icon, and the Permission icon are disabled.
Trash
Any Dashboard deleted from the list page is moved to the Trash folder. Deleted dashboards are stored up to 90 days in the Trash folder. You can Restore or Delete a dashboard permanently from the trash folder.
Pagination
Use the pagination tool to navigate through different pages of the dashboard list. You can also select to view Dashboards in sets of 20, 40, or 60 on a single page.
Create or Edit Dashboards
Click Create Dashboard to build a new Dashboard. To edit an existing dashboard, click the dashboard name from the list view to navigate to the edit screen. For more information on how to configure dashboards, refer to the Configure Dashboards article in the Additional Resources section at the end of this article.
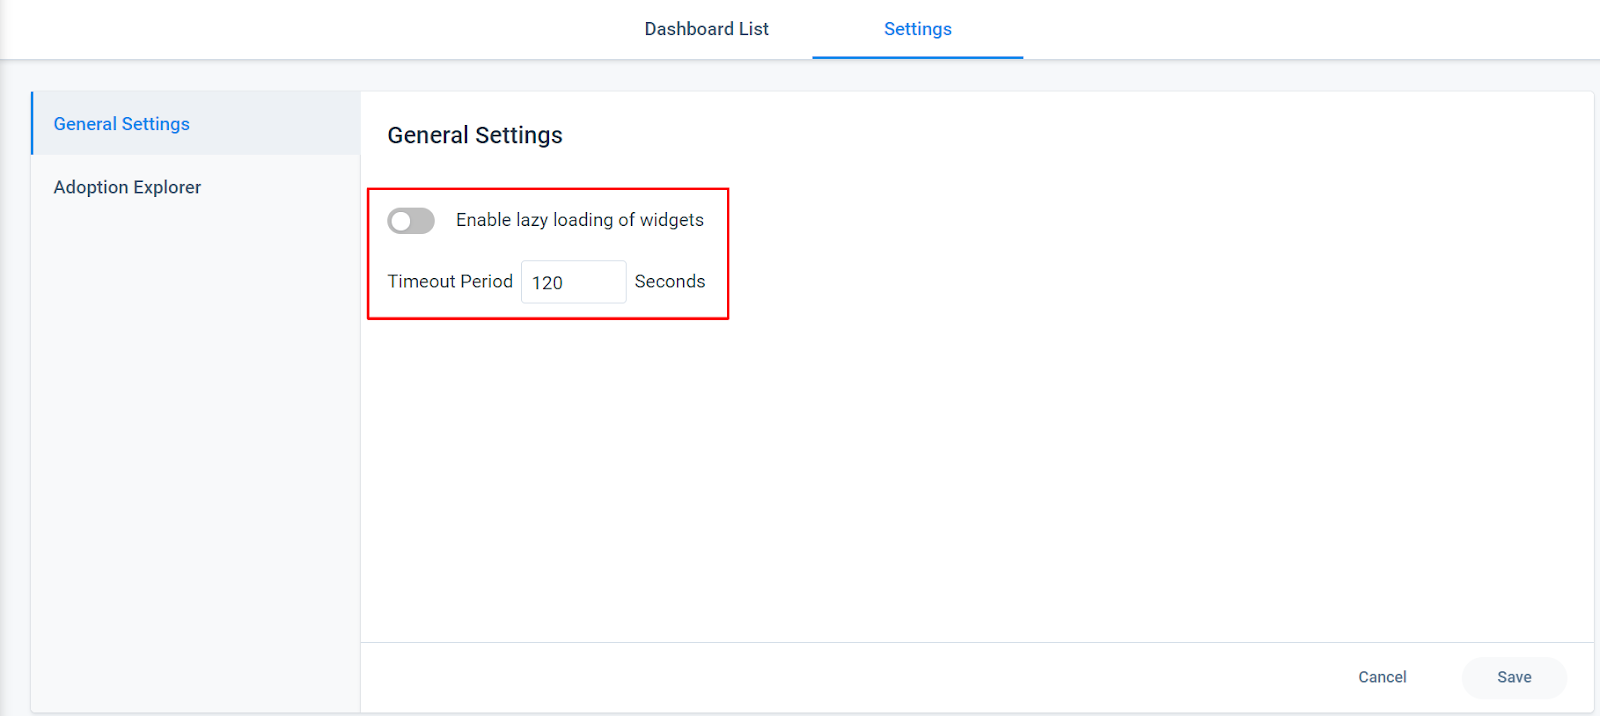
Setting Options
Navigate to the Settings page to view the following options:
- General Settings
- Adoption Explorer
General Settings
In the General Settings tab, admins can configure the following settings:
- Enable lazy loading of widgets: Turn on the switch to enable the lazy loading of the widgets on Dashboards. This improves the Dashboard page’s initial load time, by making sure only the widgets visible on the Dashboard page are loaded. The number of widgets you see on the screen depends on your screen resolution.
For example: Assume you have a Dashboard that contains 10 widgets, and that you have enabled the lazy loading option. Based on your screen resolution, only two widgets are visible. Initially, only those widgets are loaded When you scroll down, another two widgets are loaded, and so on. - Timeout Period: Assign a Timeout period for loading widgets. The Timeout Period limits the time that the Dashboard allocates for the widget to load. This is helpful when widgets with large data are slow to load, affecting the overall load time of the Dashboard.
Note: The minimum Timeout period that can be set is 10 seconds. The maximum Timeout period is 120 seconds.
Adoption Explorer Widget Settings
In the Adoption Explorer tab, you can add the Usage Reports from AE Layouts as a widget to the Gainsight Dashboard. You can also see the list of Widget Names and Widget Paths in this section.
To add a Widget:
-
Click Add Widget.
-
In the Enter Name field, provide the widget name as required.
-
From the Adoption Explorer Project dropdown, select the required project.
-
From the Usage Dashboard from the Project dropdown, select the required Freeform dashboard report.
Note: Only Freeform layouts can be added as a widget to the Dashboard. -
From the Usage Report from the Dashboard dropdown, select the required usage report.
-
In the Preview section, you can view the widget data, select the report, set the time frame, and can select the required chart type.
- Click Add Widget.
Note: This selected widget will be displayed as default in the Dashboard. However, users viewing the Dashboard can select other usage reports in the AE layout from the dropdown list.