Renewal Center User Guide
Gainsight NXT
This article walks the users through various components of Analyze and Forecast pages in Renewals and how to use them to manage opportunities and accounts better.
Overview
Gainsight’s Renewals enables your team to gain predictability and control over your renewals business with accurate forecasting, real time reporting, and robust analytics.
With Renewals, you can easily accomplish the following Renewal goals:
- Forecast to Build Accurate In-Quarter and Near Term Renewals Forecasts
- For each open renewal opportunity, Gainsight provides a likelihood-to-renew score based on data-driven measures of customer health.
- See forecast accuracy improve over time as the Machine Learning algorithm learns from your data and past business outcomes.
- Easy-to-update views of upcoming renewals so managers and reps can input their forecast call.
- Prepare to Quickly Obtain an Up-to-Date View of Your Book of Business
- View the most up-to-date in-quarter forecast metrics side-by-side with Gainsight’s predictive forecast.
- Obtain a roll-up view of outstanding renewal dollars, as well as actual closed, churned, and upsell; filter the entire view by your book of business.
- Highlight and correct potentially missed opportunities.
- Quickly access and visualize the status of at-risk opportunities alongside customer insights for that account.
- Analyze to Gain a Deeper Understanding of Where Risk Exists
- Analyze both Forecast by Booking type as well as the composition of churn with interactive charts.
- Filter by geography, industry, segment, or other business-relevant attributes to better understand where to pay more attention.
- Drill down into individual renewals and see the latest activity, updates, customer health insights, and potential risks.
Components of Renewal Center
The Renewals section consists of two main pages; Analyze and Forecast. The Analyze page displays key metrics related to your renewals in numerical and graphical forms. On the Analyze page, you can see what matters and quickly take action. The Forecast page displays a list of all your renewal opportunities at both the opportunity and account level.
Renewals has a Global Filter component that is available on both Analyze and Forecast pages.
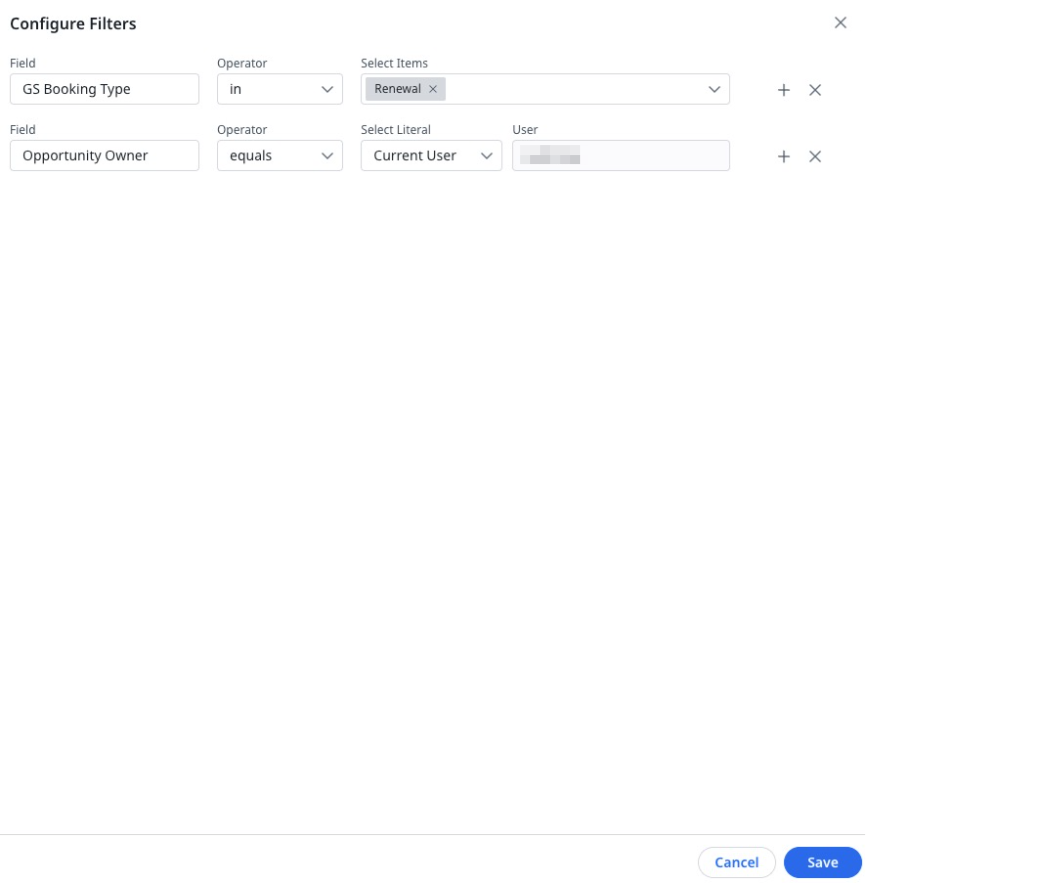
Global Filter
Global Filter helps you to filter your renewal data. Executives or renewal team managers, who do not own any opportunities themselves, can use the Global filter to view the opportunities of their team members. You can also apply a filter to view opportunities of a specific region or location. The fields which are configured by your admin can be used for setting filter criteria. You can set multiple criteria if required. The AND logic is applied to evaluate multiple criteria.
To apply filters:
- Click the filter icon at the top-right.
- Click Add Filter.
- The Configure Filters slide-out panel appears. Provide the required details.
- (Optional) To add a new field, click the + icon.
- (Optional) To remove an existing field, click the x icon.
- Click Save. Filters are applied successfully.
Notes:
- You can remove existing filters and add new filters using the Modify Filter button.
- To update the existing filters, click the filter criteria.
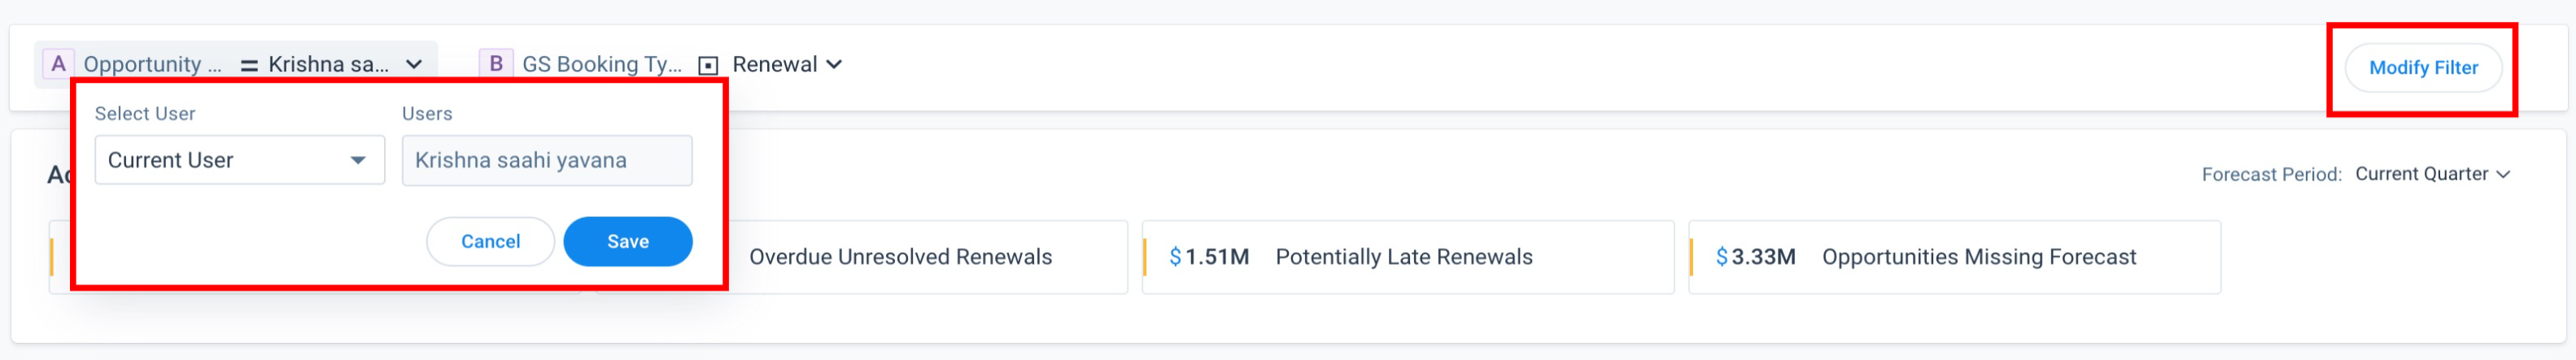
- By default, the renewals owned by the logged-in user are displayed. If the logged-in user does not own any renewals, they can modify the global filter to select other users, segments, or geographies.
- You can save filters as views using the Save and Save As options that appear when you add or update the filters to save the changes. To read more about Views, refer to the Custom Views in Renewal Center in the Additional Resources section of this article.
- You can filter data using the Custom Fiscal Periods configured by the admin. For more information, refer to the Custom Fiscal Year section in the Application Settings article.
- The global-filter strip is available in the Forecast section on the C360 page and in the Forecast widget on the Gainsight Home page.
- The global filter supports the RC Opportunity object.
Limitations:
- The Include Nulls and Clear buttons are not available while updating existing filters.
- The Value field cannot be left blank while adding a filter criteria to save and apply filters.
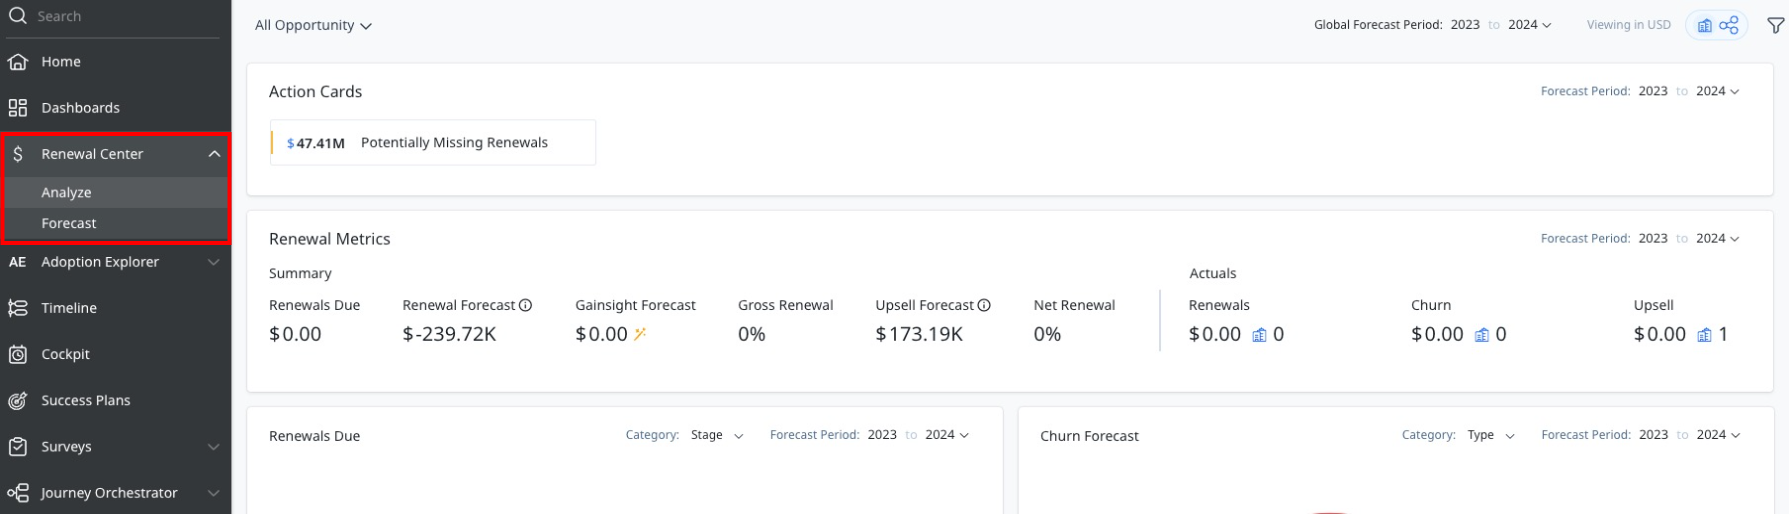
Analyze
The Analyze page contains information on six key fields related to your renewals. To access this page, navigate to Renewals > Analyze.
Widgets
The Analyze page offers the following widgets:
- Action Cards
- Summary
- Actuals
- Renewals Due
- Booking Type
- Late Renewals
- Churn
- Renewal Waterfall
- Renewals Due By Health
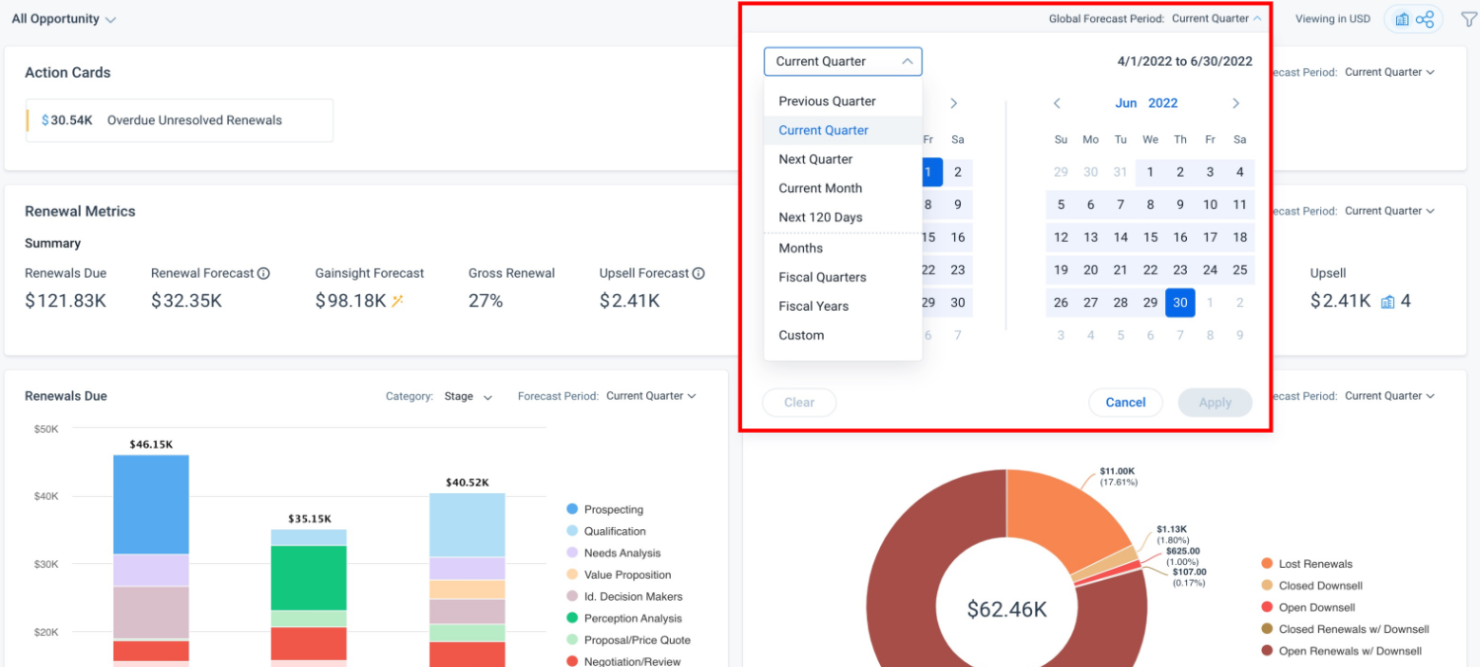
Global Forecast Period: You can use dynamic filters to select your Forecast Period for the widgets. Select predefined options of Current Quarter, Next Quarter, Current Month, or Next 120 Days forecast periods. You can also select the exact date ranges using the Custom option or apply the customized fiscal periods using the Fiscal Year and Fiscal Quarter options.
Global Forecast Period allows users to select the required Forecast Period (Custom date range or Pre-built time frames) to filter the data of all the widgets at once. For example, if you want to view all the widgets’ data for the next quarter, you can select the Next Quarter option from the Global Forecast Period dropdown list and it is applied to all the widgets at one go.
To configure Forecast Period:
- Click the Forecast period of the required widget and create your range by using the dynamic filter options.
- Click Apply.
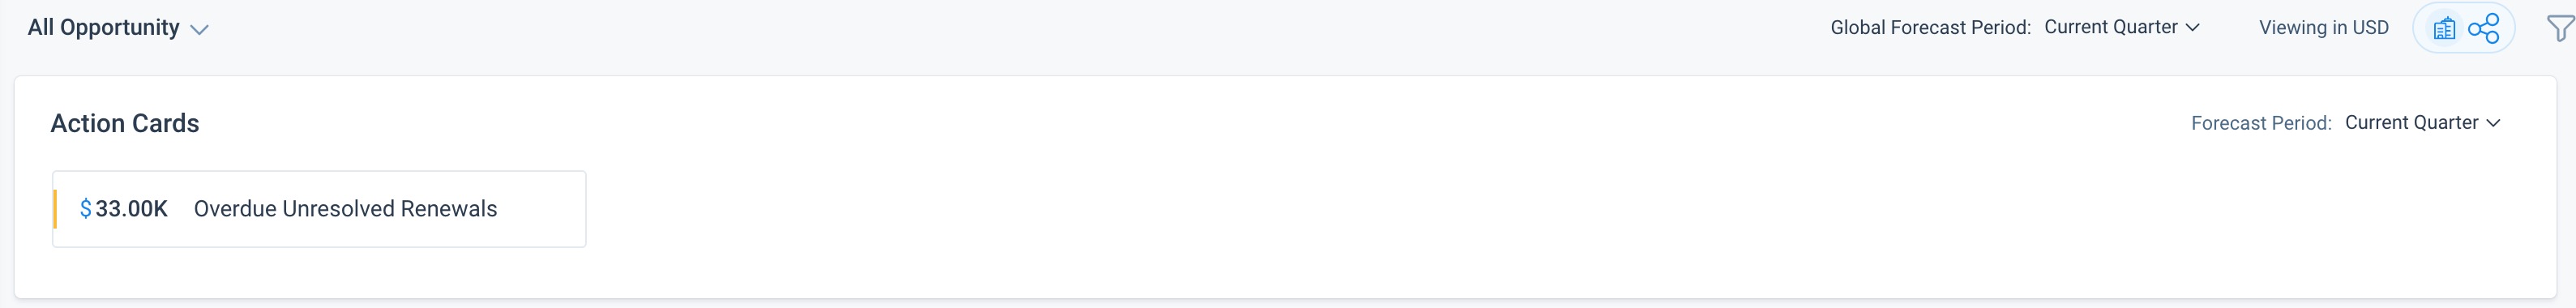
Action Cards
This section analyzes the opportunities in your book of business and highlights areas that you may need to take action. It evaluates opportunities based on the global filter and quarter that has been applied. There are four cards in this section, but they will be displayed only when applicable. Click the > icon to see the details and take action. The four panes are:
- Potentially Missing Renewals: This card displays companies that have renewal dates coming up but do not have a renewal opportunity. Click the > icon for this card to view a list of these companies. Click ADD to create an opportunity for such companies.
Note: The Global Filter is based on Opportunity fields and does not apply to this Action Card since the card does not contain opportunities. This card displays companies that have upcoming renewal dates but do not have a renewal opportunity per due date/close date in the same renewing time frame. - Overdue Unresolved Renewals: This card displays opportunities that are past their due date but are yet to be closed. When you click > icon for this card, you can view a list of opportunities whose renewal date has exceeded the current date. Click > for each record to take suitable action.
- Potentially Late Renewals: This card highlights renewals from accounts recently late and enables users to take proactive steps to bring the renewals on time or set proper expectations.
- Opportunities Missing Forecast: This card displays renewal opportunities whose forecast amount has not been updated. The overall value shown is based on the target amount. When you click > icon for this card, you can view a list of companies whose Forecast amount is missing. Click > for each record to take suitable action.
- High Churn Risk Renewals: This card displays opportunities that are at the highest risk for churn. Click > for each record to take suitable action.
Summary
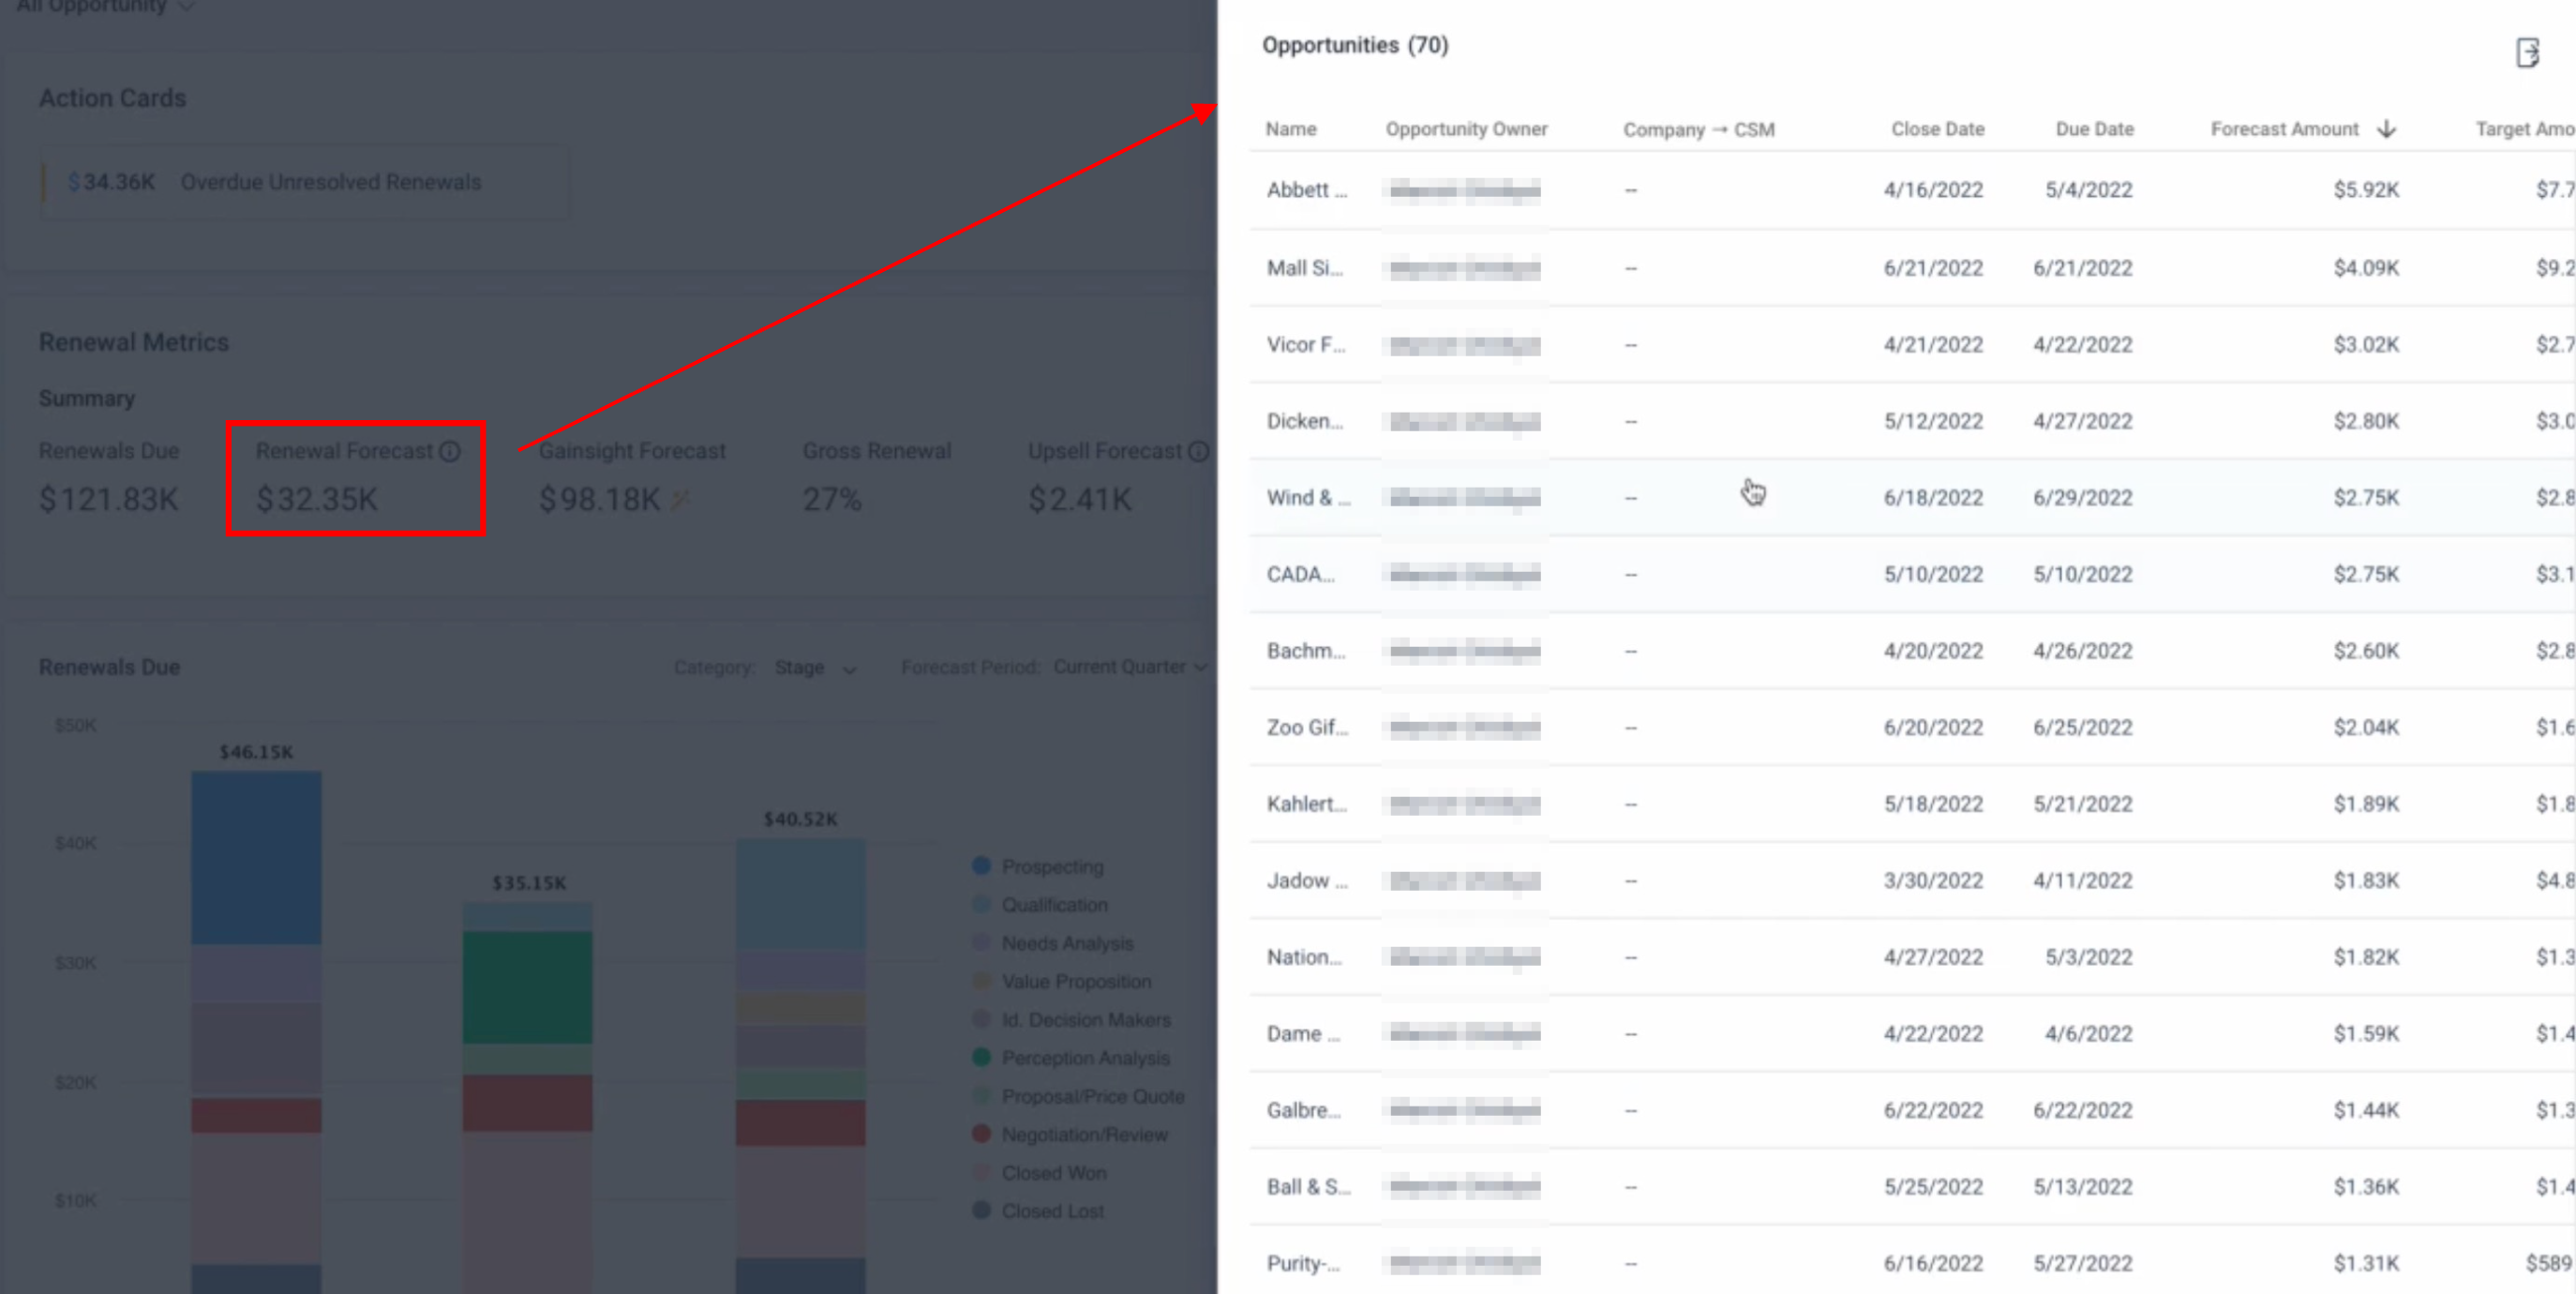
This section displays the important metrics related to your renewals. You can drill through all the KPI's in the Summary listing to see the details of the opportunities that make up the numbers. You can also perform edit operations in the opportunity details.
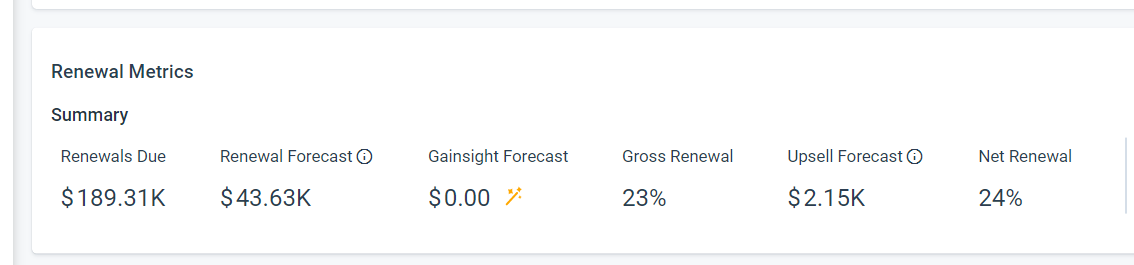
The metrics are:
- Renewals Due: The sum of renewal target amounts for all renewal opportunities.
- Renewal forecast: Gainsight Forecast only includes renewals to be comparable with Renewals Due and Renewal Forecast. Forecast scenarios are provided based on how your company has decided to roll up opportunities by Forecast Categories and Probability. There are multiple methods to configure the calculation of this metric. Your admin can select one of the available methods to perform the calculation. The value displayed is after performing the calculation by using the calculation method set by your admin. However, you can hover on the tooltip attached to Your Forecast metric to view the value, if other calculation methods were applied.
- Upsell Forecast: Separating Renewal and Upsell forecasts make it easier to see what goes into Gross Renewal and Net Renewal rates. However, you can hover on the tooltip attached to Your Forecast metric to view the value, if other calculation methods were applied. To learn more about the calculation methods for this metric refer to the Forecast section of the Configure Renewal Center article in the Additional Resources section of this article.
- Gainsight Forecast: This is a Machine Learning based forecast. To learn more about how this calculation is performed, refer to the Renewal Center Metric Calculations article in the Additional Resources section of this article. Also, if you are unable to view this section, refer to the Settings section of the Configure Renewal Center article in the Additional Resources section of this article.
- Gross Renewal: Gross Renewal Rate is the percentage of opportunities renewed in the period. GRR does not include upsell.
- Net Renewal: Net Renewal Rate is the rate at which customers are renewing and expanding. It differs from Gross Renewal Rate, which only shows the rate at which customers are renewing and does not take upsells into account.
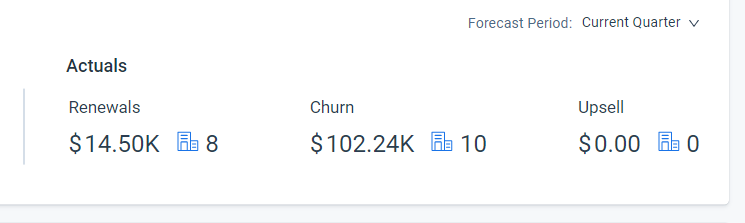
Actuals
This section displays the data regarding closed opportunities in the selected quarter. This section displays the metrics and also the number of companies that contributed to that metric. You can drill through all the KPI's in the Actuals listing to see the details of the opportunities that make up the numbers. You can also perform edit operations in the opportunity details.
There are three key metrics:
- Renewals: Final amount of renewal opportunities that were won.
- Churn: The sum of lost renewals, closed downsell (downsell tracked as separate downsell opportunities), and downsell from won renewals.
- Upsell: The sum of Upsell Renewal opportunities and renewal opportunities which were closed with a higher amount than forecasted.
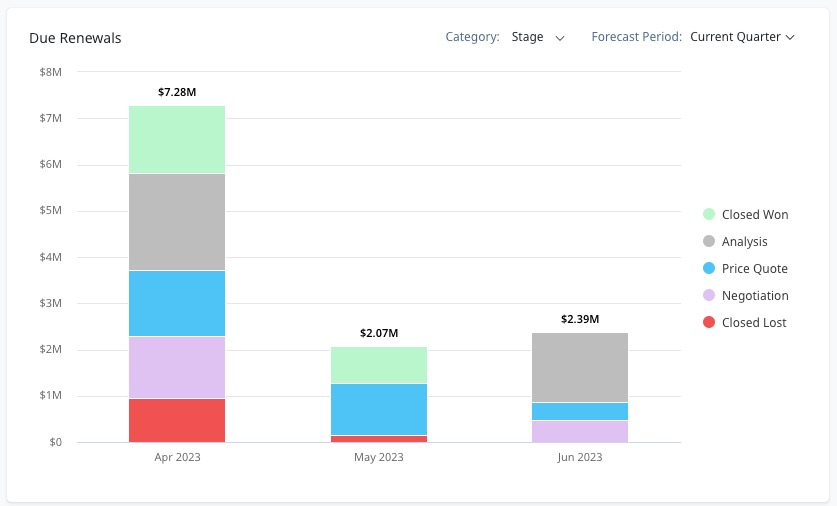
Renewals Due Chart
Renewals Due Chart provides a visual representation of the opportunities that are due for renewal. You can now view and take action on opportunities that may not be progressing appropriately given when it's due and the current stage.
Renewals Due Chart provides a visual representation of the opportunities that are due for renewal. You can now view and take action on opportunities that may not be progressing appropriately given when it's due and the current stage.
You can select the category from the following options in the dropdown list to display in the Renewals Due chart:
- Stage - Default
- Forecast Category
You can click on the opportunity stages or forecast category to view the list of opportunities and then drill down to each opportunity and take action.
Notes:
- The chart can show a maximum of 12 bars of data.
- If the data for the selected Forecast Period stretches beyond 12 bars, then the chart is displayed in terms of the subsequent level of period granularity. For example, if you select five years, then the chart shows five bars each representing a year instead of showing 20 quarters.
- The amount shown on each bar is the sum of Target Amounts of all the opportunities in the given period.
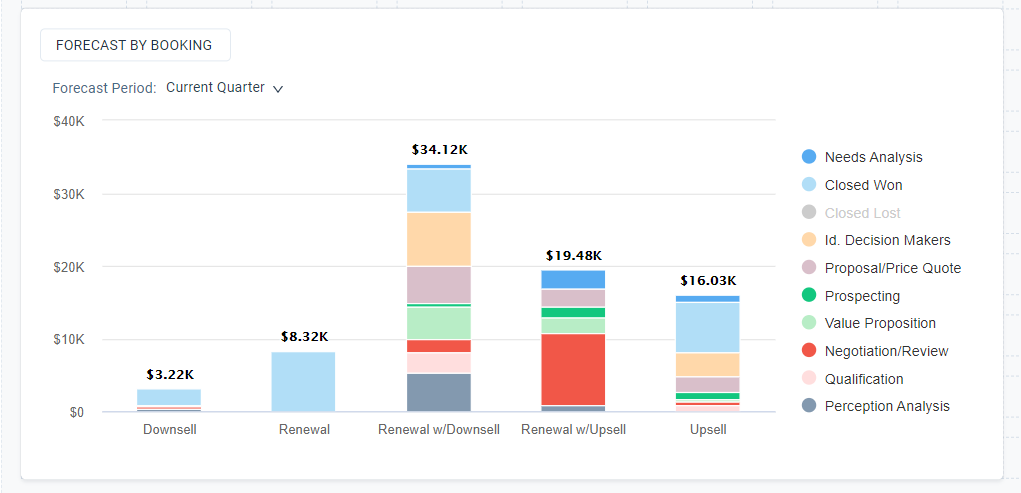
Forecast by Booking Type Chart
Booking Type is displayed as a stacked column chart. Each bar in the chart represents a booking type (x-axis) and the corresponding forecast value (y-axis). Each bar is divided into sales stages as per the forecast amount. You can hover your mouse over each stack to view drill-down data.
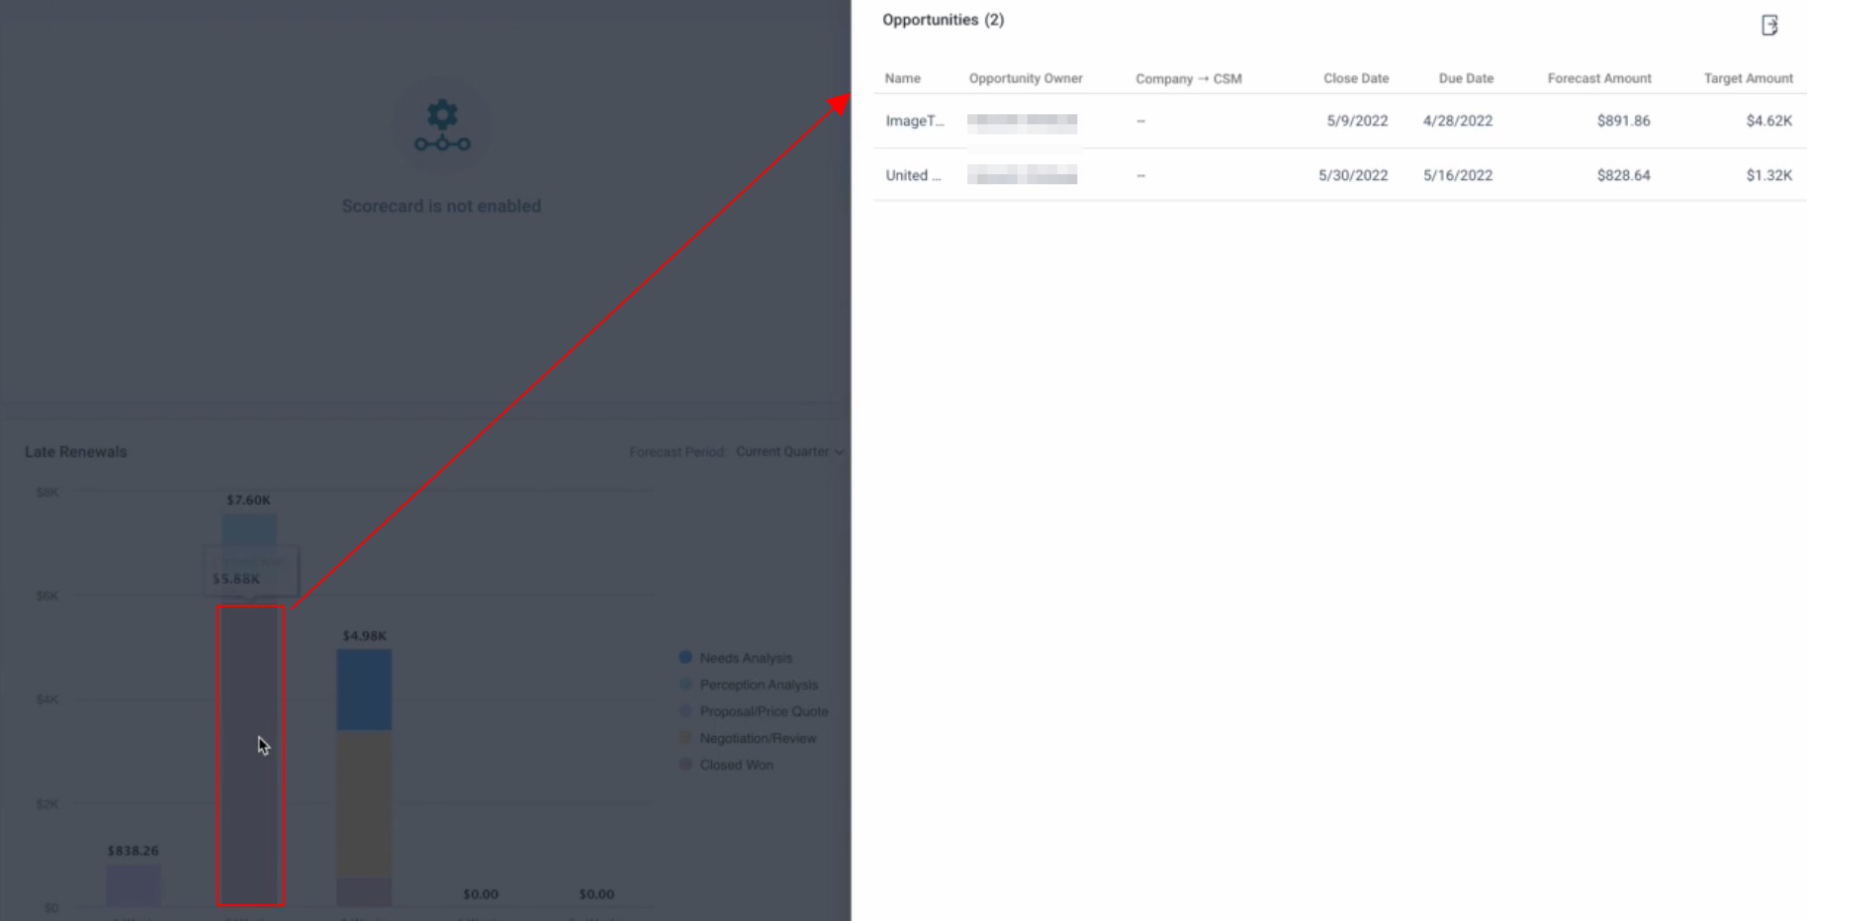
Late Renewals Chart
The Late Renewal chart gives a categorized view of the opportunities with Close Date after the renewal Due Date. Each bar on the chart shows the opportunities that were delayed by a certain number of week(s). The first bar shows the opportunities late by a week, the second bar shows the opportunities delayed by two weeks, and so on.
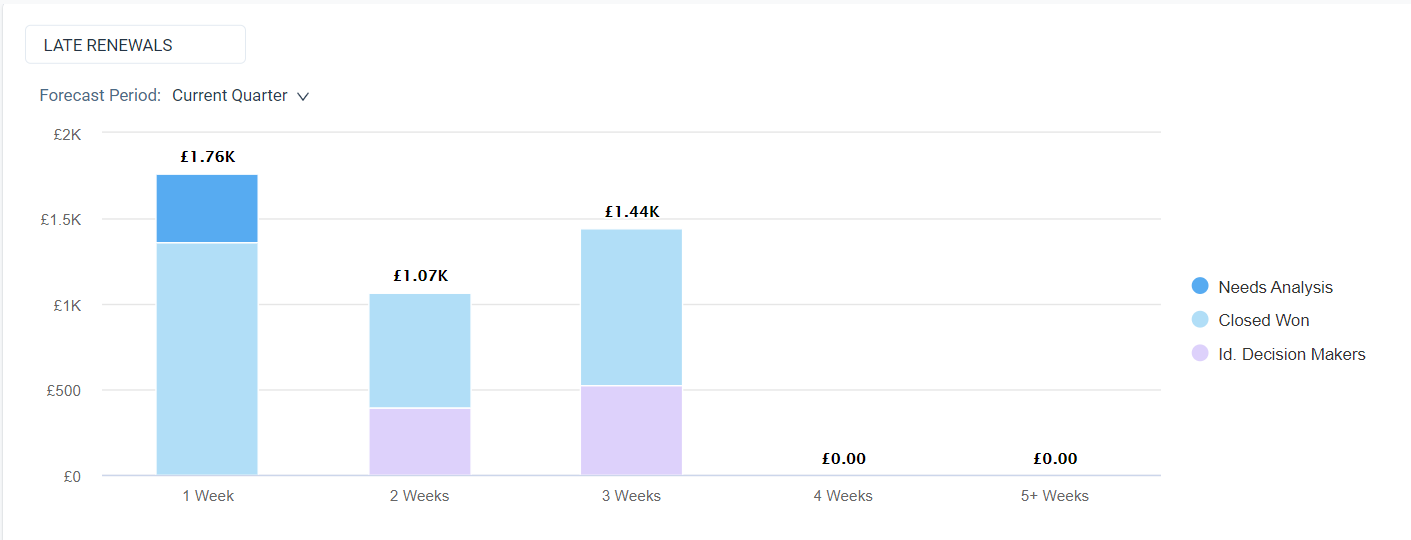
Click on the opportunity stage on the chart to view the list of opportunities and then drill down to each opportunity and take action.
Churn Forecast Chart
Churn data is displayed as a pie chart. Each Churn Category is displayed in a color, configured by your admin. You can hover your mouse over each stack to view drill-down data. The value in the center of the circle represents the total sum of churn incurred in the selected quarter.
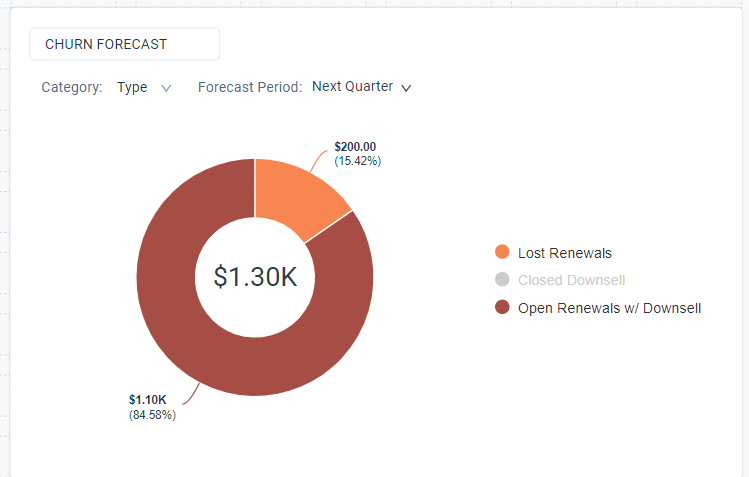
For a detailed explanation of how these metrics are calculated, refer to the Renewal Center Metric Calculations article in the Additional Resources section of this article.
Actions on Graph: You can perform the following actions on the Analyze page charts:
- Analyze churn reasons: You can learn about the churn reasons, by tracking them via the churn chart. When you select the Category as Primary Reason, the Churn Chart groups the opportunities based on the different churn reasons that you have configured in Data Management. The opportunities with no churn reasons selected are grouped under No Reason Selected Category. When you provide the churn reason by editing the opportunity details, the chart regroups the opportunities.
When you further drill down to each category of churn reasons in the chart, you can view the Churn Total for each opportunity.
- Exclude a Legend: If you do not wish to view any legend (parameter) in the graph, you can click the legend, to exclude it from the graph. The excluded legend is greyed out.
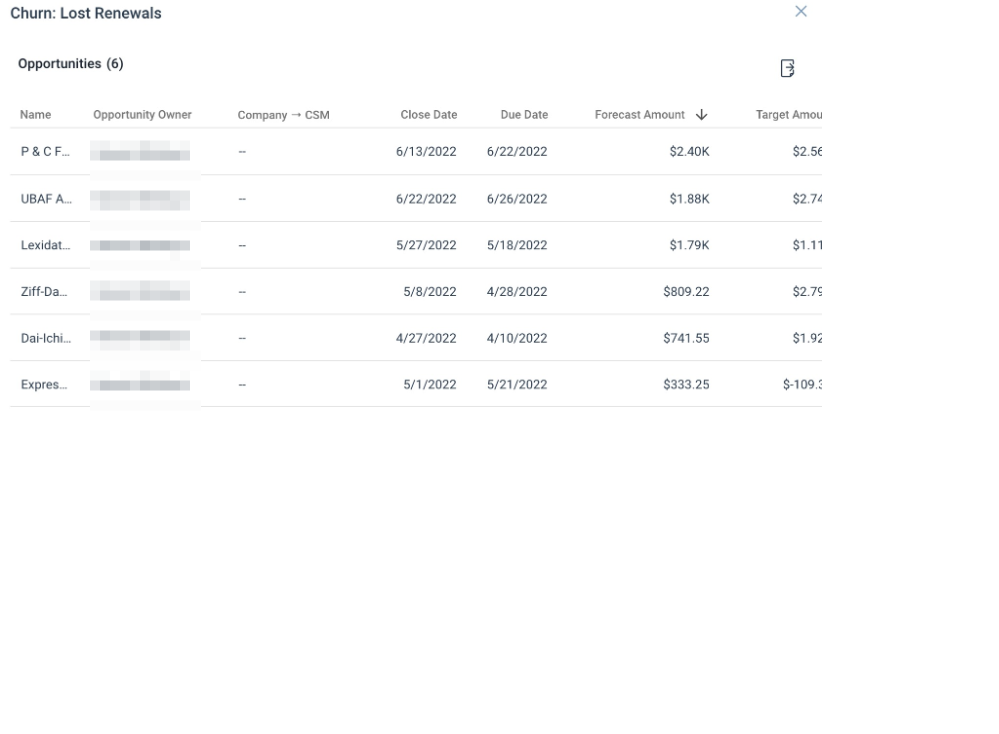
- Drill Down and Export Data: You can drill down to view all the Opportunities which are contributing to a graph by clicking a parameter. You can click export, to export this list.
- Sort and Export Data: You can also sort data in Drill down windows. You must click the required field name to sort data of that field. When you click a column for the first time, data is sorted alphabetically/ascending order, based on the data type of the field. When you click the column again, the data is sorted in descending/reverse alphabetic (Z-A) order. When you export data after sorting, the sorting is not honored in the exported CSV file.
Renewal Waterfall Chart
Renewal Waterfall chart provides a graphical explanation of what is happening to your renewal business through the Renewal Waterfall Chart. This chart explains:
- What is happening with Renewals Due in the selected time period
- What is available to renew
- Expected Downsell
- Explains Gross and Net Renewal Rates
All the data shown is for renewals which fall in the selected time period. The Renewals Waterfall chart displays both the actual and forecasted values.
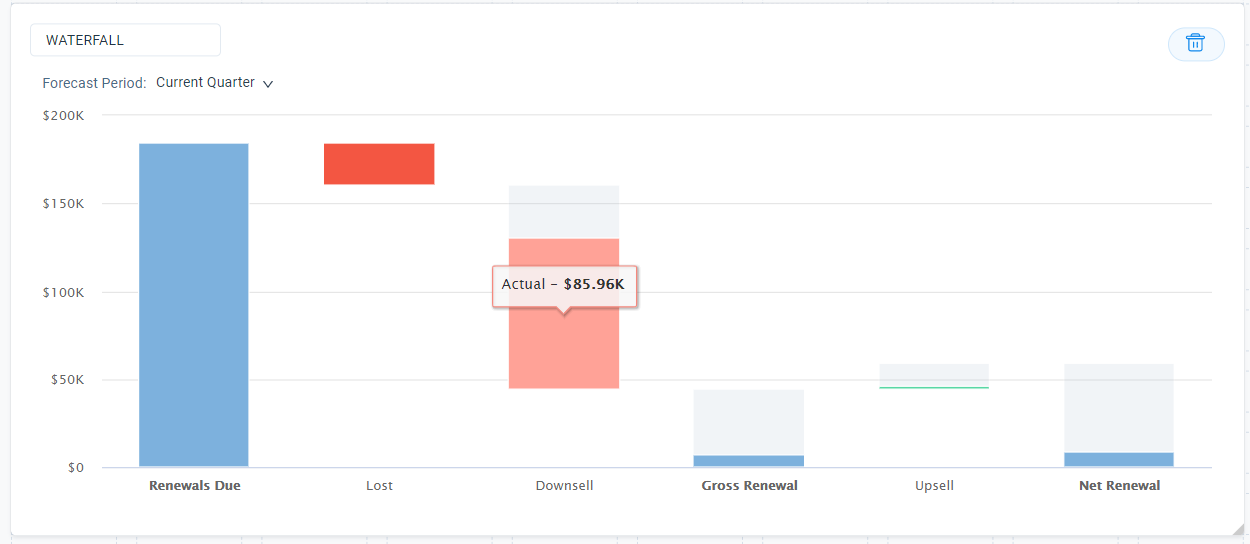
Analyze the Renewal Waterfall Chart:
- Renewals Due: The sum of Target Amount of all renewals which are due to be renewed for the logged-in user (or the user whose renewals are being filtered).
- Lost: The total sum of renewals lost in the selected time period. This is the sum of all the opportunities which were closed with a Lost status.
- Downsell: The total sum of renewal opportunities that were won but with a downsell. Opportunities with a status of closed and whose Final Amount was less than Target Amount are shown under the Actuals section, and opportunities whose status is Open but have the target Amount less than the Forecast Amount are displayed under the Open section.
- Gross Renewal: The gross sum of opportunities renewed in the selected time period. The actual and forecasted values are shown separately.
- Upsell: This field displays the sum of opportunities whose Target Amount is greater than Forecast Amount for Open Opportunities and the Final Amount was greater than Target Amount for closed opportunities.
- Net Renewal: The actual sum of opportunities renewed and forecasted to be renewed.
- Drill down and Download Data in Waterfall Chart: Apart from viewing specific data, you can also drill down to view a list of opportunities that contributed to specific data. You can also download this data as a CSV file.
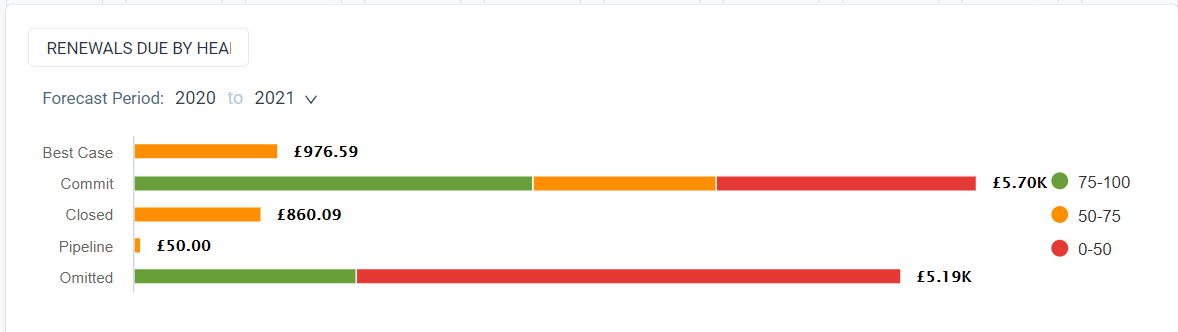
Renewals Due by Health Chart
Renewals Due By Health chart enables executives to understand renewals in the context of health and forecast category, especially where there is misalignment. For example, are there opportunities that are not expected to renew but are healthy. This could mean there are churn reasons out of your control or that the health scorecard is not capturing important context.
Forecast
The Forecast page displays all of the opportunities and accounts based on the global filter. In this section, you can view all of the opportunities (in list view and detail view), edit opportunities, add new opportunities, as well as edit Scorecard and create Timeline data for customers.
You can also view all the opportunities categorized by their accounts. The My Forecasts view under the Company Views section is available by default when the admin turns on the Show Company View toggle switch. For more information on all the CSM actions in account based forecasting, refer to the Account Based Forecasting (Company View) for CSMs article.
Forecast Page Tasks
This sub-section explains the various tasks which you can perform on the Forecast page.
Edit Opportunity
To edit an opportunity:
- Double click the field to be edited and modify the value.
- Click the save icon to sync data back to the Salesforce opportunity. Data is saved only if all the validation rules in Salesforce are passed. If any validation rule is not passed, save action fails and returns an error message, so that you can take appropriate actions.
Note: You can edit only the fields that are configured as editable by your admin.
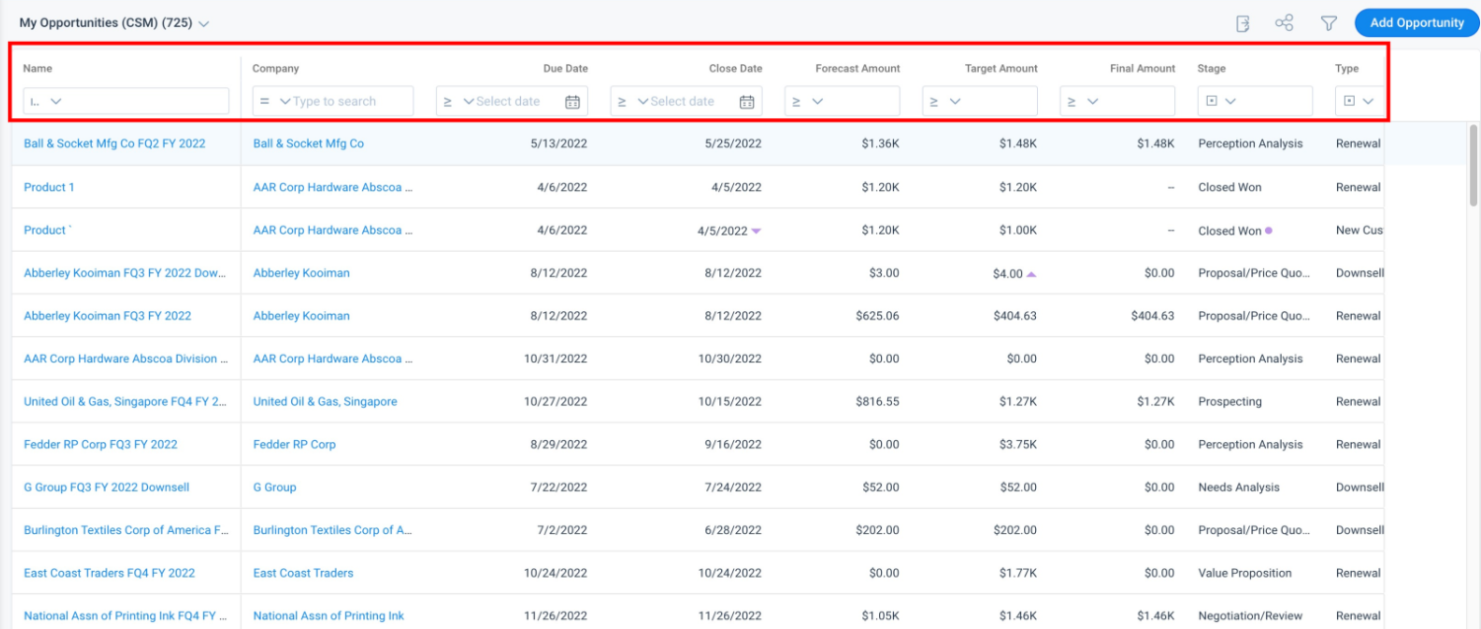
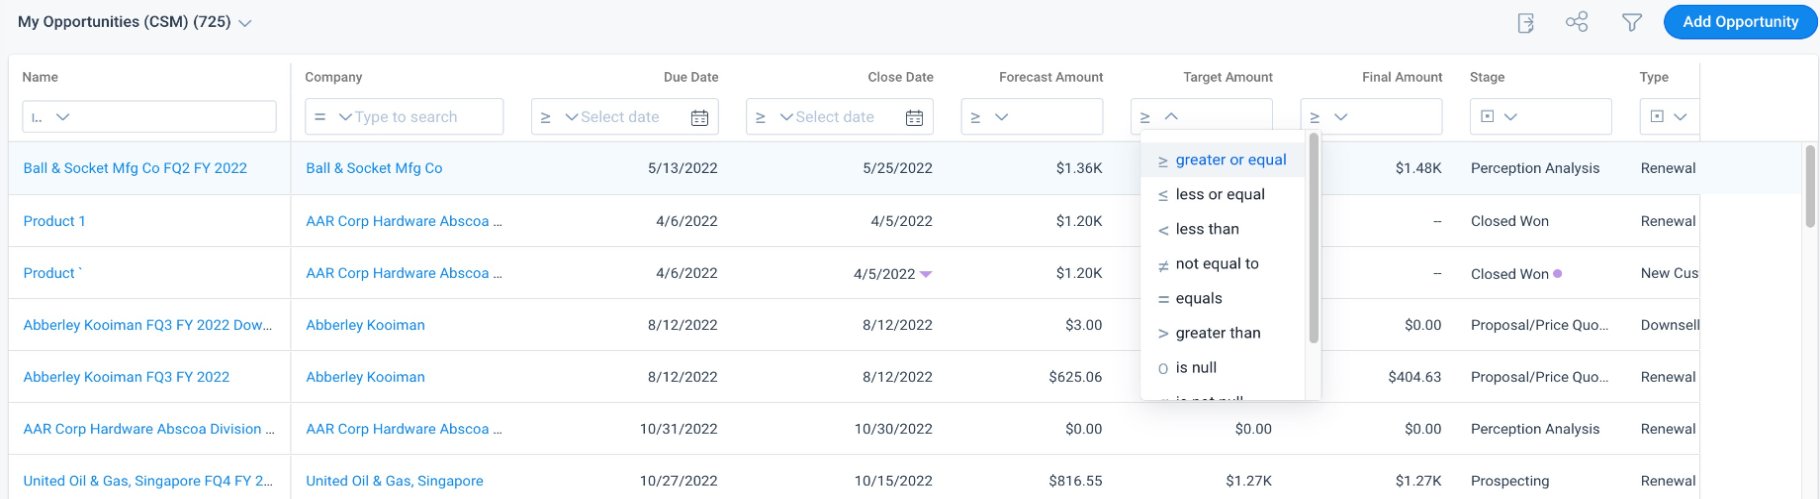
Use Column Level Filters
You can filter data on individual columns from the Forecast table. The operators provided in the column level filter vary for each field and are dependent on the data type of the field. Server-side filtering is done in the column level filters. The data displayed in the Forecast table is based on the filters applied in the global filter. Column level filters can be applied on this data which is displayed after incorporating the global level filters.
To use Column Level Filters:
- Navigate to Renewals > Forecast.
- Apply the appropriate filters for the required columns.
-
(Optional) Click X to remove an applied filter.
IMPORTANT: Once you apply all the required filters, you can also sort data in a column either in ascending/descending order (Number, Currency, Date, Date time data fields) or alphabetical order (for string data type fields). The sorting performed is Server side. When you click a column for the first time, data is sorted alphabetically/ascending order, based on the data type of the field. When you click the column again, the data is sorted in descending/ reverse alphabetic (Z-A) order.
Notes:
- While applying filters, you can search for the required values. You must enter search terms which are in line with the Datatype of the field; for example, you cannot enter letters for Date, Datetime, Number, or Currency Data Type fields.
- Currently, you cannot apply column-level filters on Text area data type fields.
- Currently, multi picklist selection is not supported in column level filters.
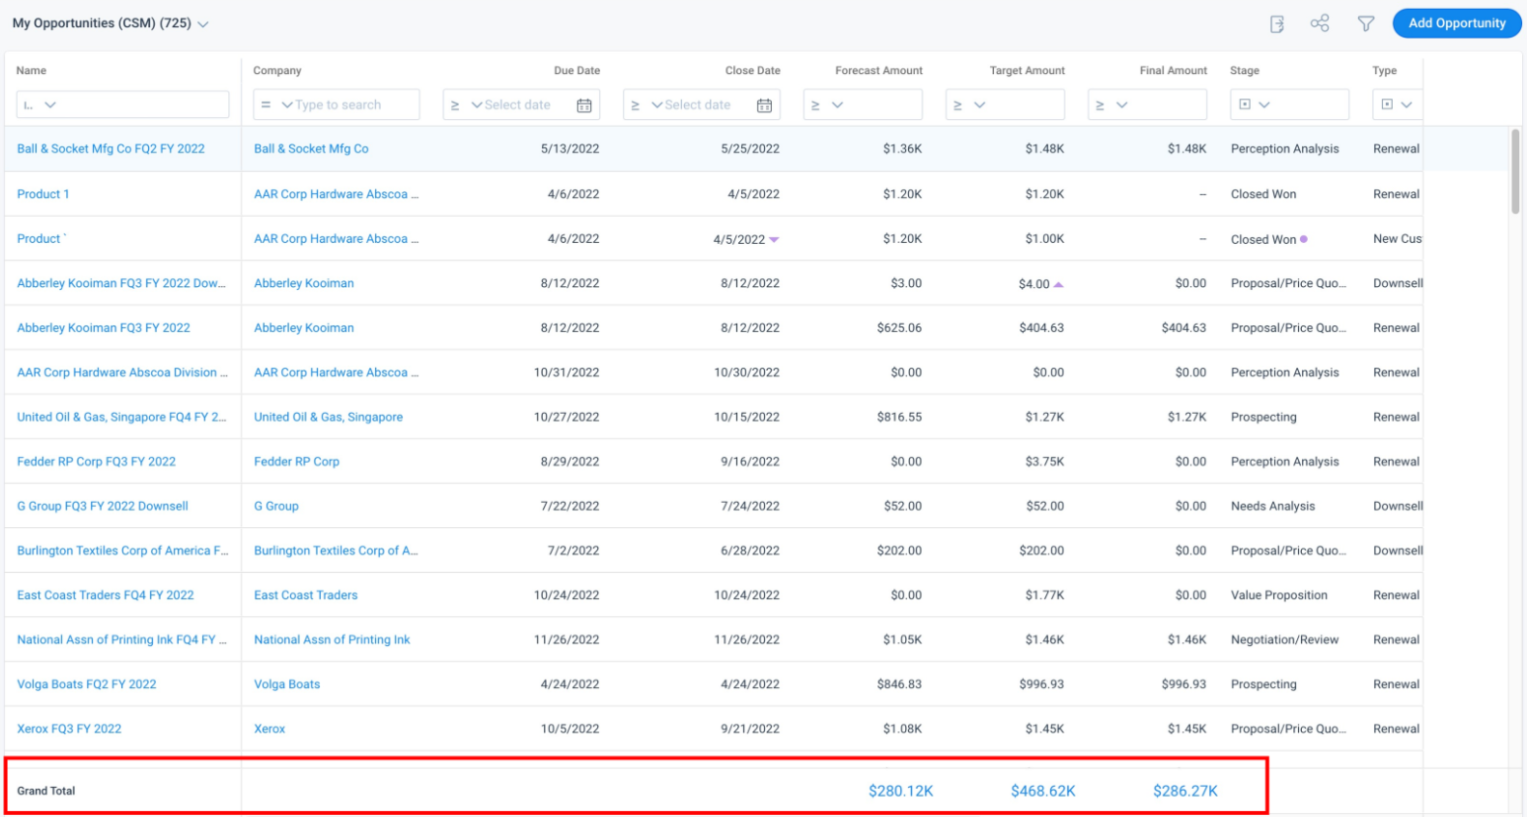
View Column Total
You can see the Grand Total for currency fields for each row. For multi-currency deployments, the Grand Total is converted to the user's preferred currency.
Switch To Detail View
You can switch to the detailed view of any Opportunity. The Opportunity detail view has four tabs. The Details tab displays additional information (more fields) about the selected opportunity. These additional fields displayed are based on the configurations set by your admin. Apart from additional details, you can also view and edit the scorecard, product, and timeline data of the selected company on the Scorecard, Product, and Timeline tabs. The Scorecard tab displays recent customer health scores. The Timeline tab displays activities performed with the customer. The Product tab displays information about the opportunity line items associated with the Company.
To switch to the detail view:
- Click any opportunity from the list view.
- (Optional) Edit the opportunity data on the Details tab.
- Click the Product tab. You can view and edit the opportunity details.
- Click the Scorecard tab. You can view and edit the scores of a Company.
- Click the Timeline tab. You can create and edit Timeline activities of a Company.
Note: You can only edit those activities that are created by you. - Click Save.
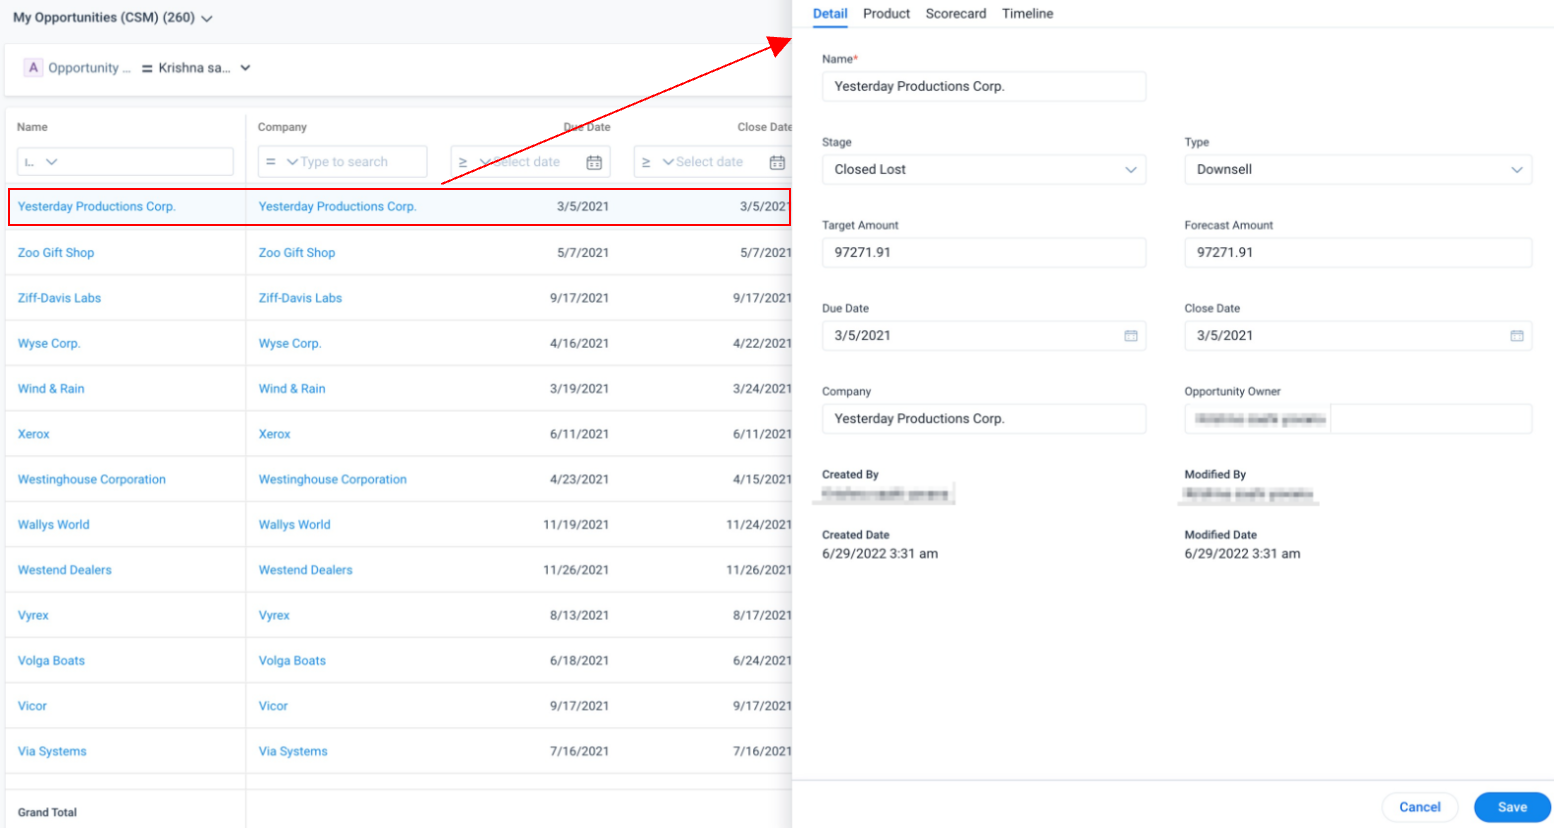
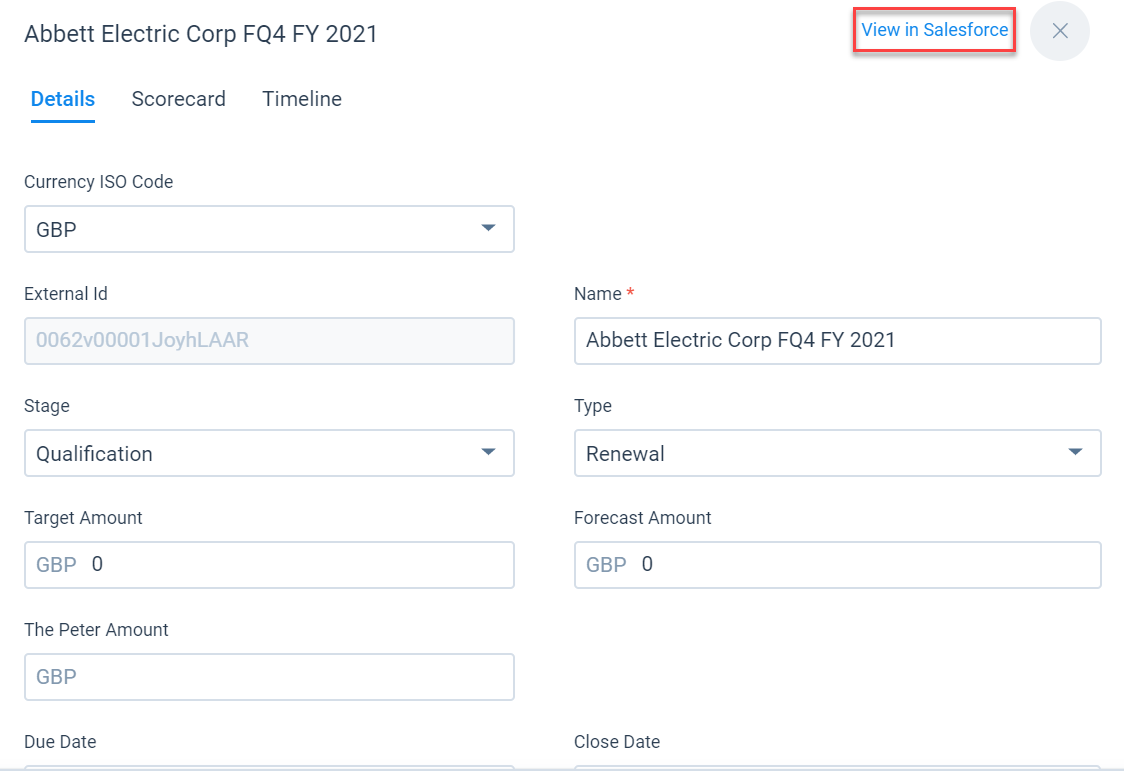
To view the opportunity in Salesforce, click the View in Salesforce button on the detail view.
Note: The View in Salesforce button is available only when the sync option is set to Sync with Salesforce by the admin while configuring Renewal Center.
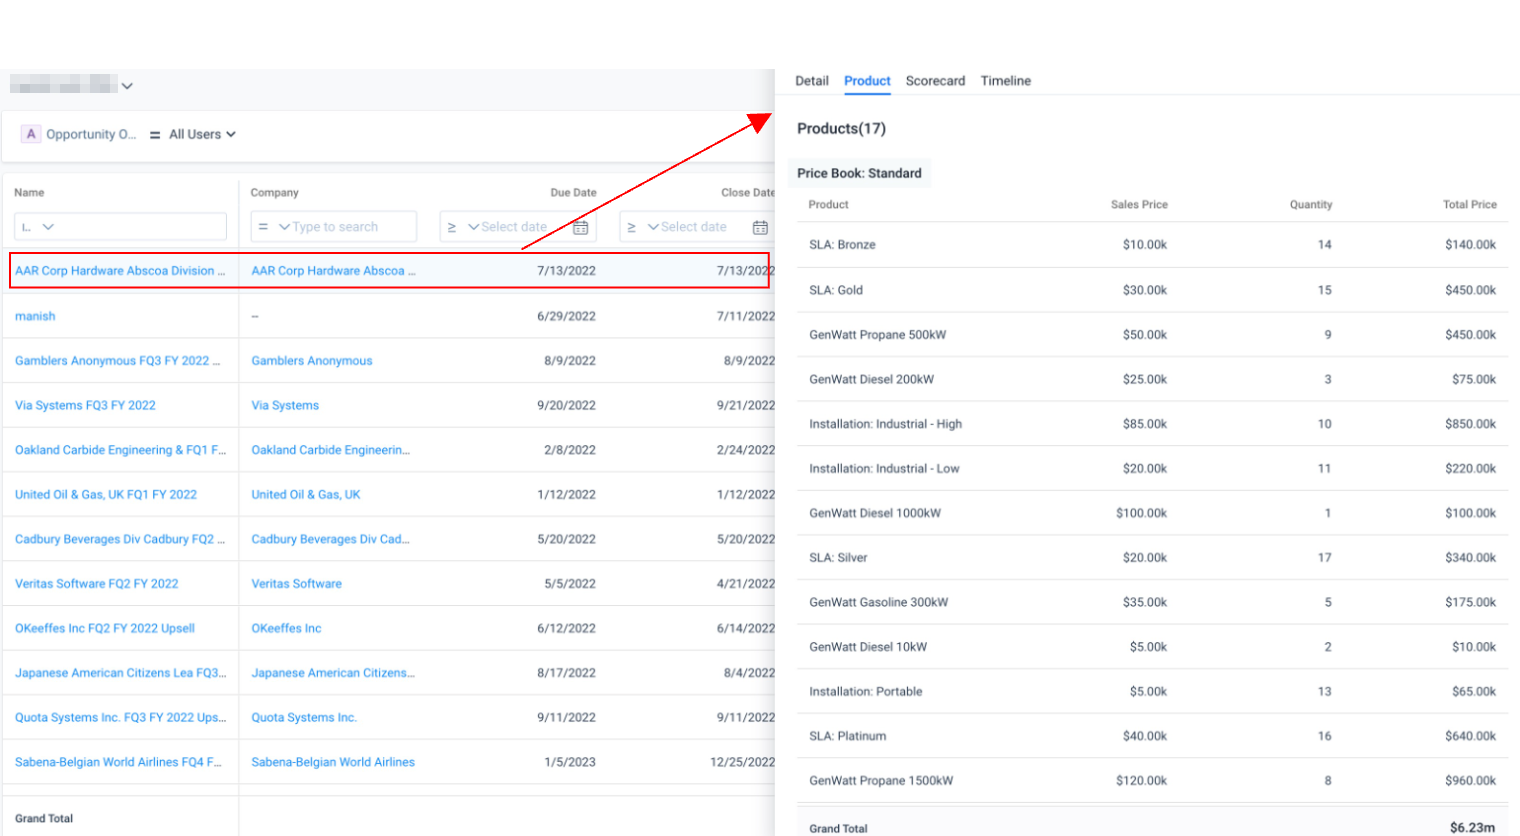
Edit Product Opportunity Details
You can edit Opportunity Product details of an Opportunity from the Product tab of the opportunity detail view. However, the option to edit is available if your sync option is configured as Gainsight only.
- Sync with Gainsight
To edit Product details:
- Click the company name to view opportunity details.
- Click the Product tab.
- Click the edit icon to edit the Standard Price and Quantity details.
- (Optional) Click the delete icon to delete an existing product details.
To add Product details:
- Click Add Product. The Add Product dialog box appears.
- From the Pricebook dropdown, select the Pricebook.
- From the Products list, select the Product.
- Click Next.
- Edit the Sales Price and Quantity.
- Click Save.
- Sync with Salesforce
The opportunity line details cannot be edited in Gainsight if the selected sync option is SFDC.
For more information on Sync Option, refer to the Configure Renewal Center article in the Additional Resources section of this article.
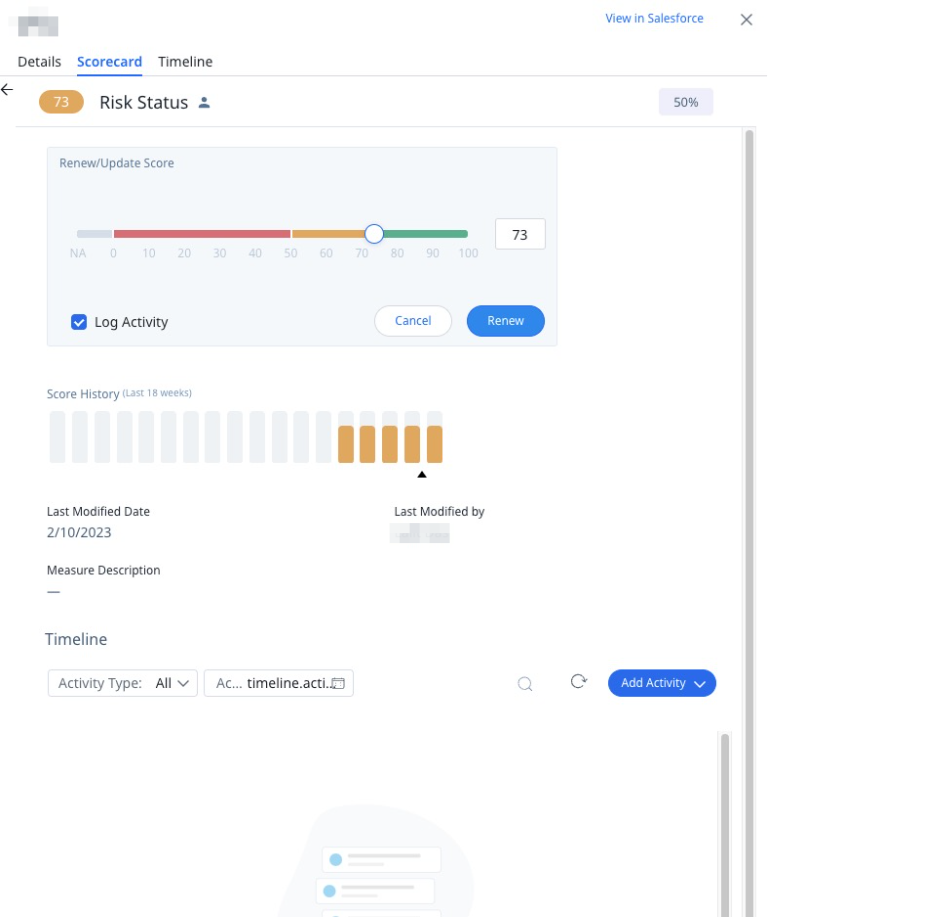
Edit Scorecards
You can edit Scorecard data of a Company from the Scorecard tab, located on the Opportunity detail view. When you modify the score for a Company's measure, this corresponding change in score is reflected on the Scorecards section, located on the Company's C360 page.
To edit scores from Renewals:
- Click the detail view icon for the required company.
- Click the Scorecard tab.
- Modify scores
as needed.
Create and Edit Activities
You can create and edit Timeline Activities from the Timeline tab of the detail view. You can edit only those activities which are created by you.
To create activities from Renewals:
- Click the detail view icon for the required company.
- Click the Timeline tab.
- Create or modify the activities, as required.
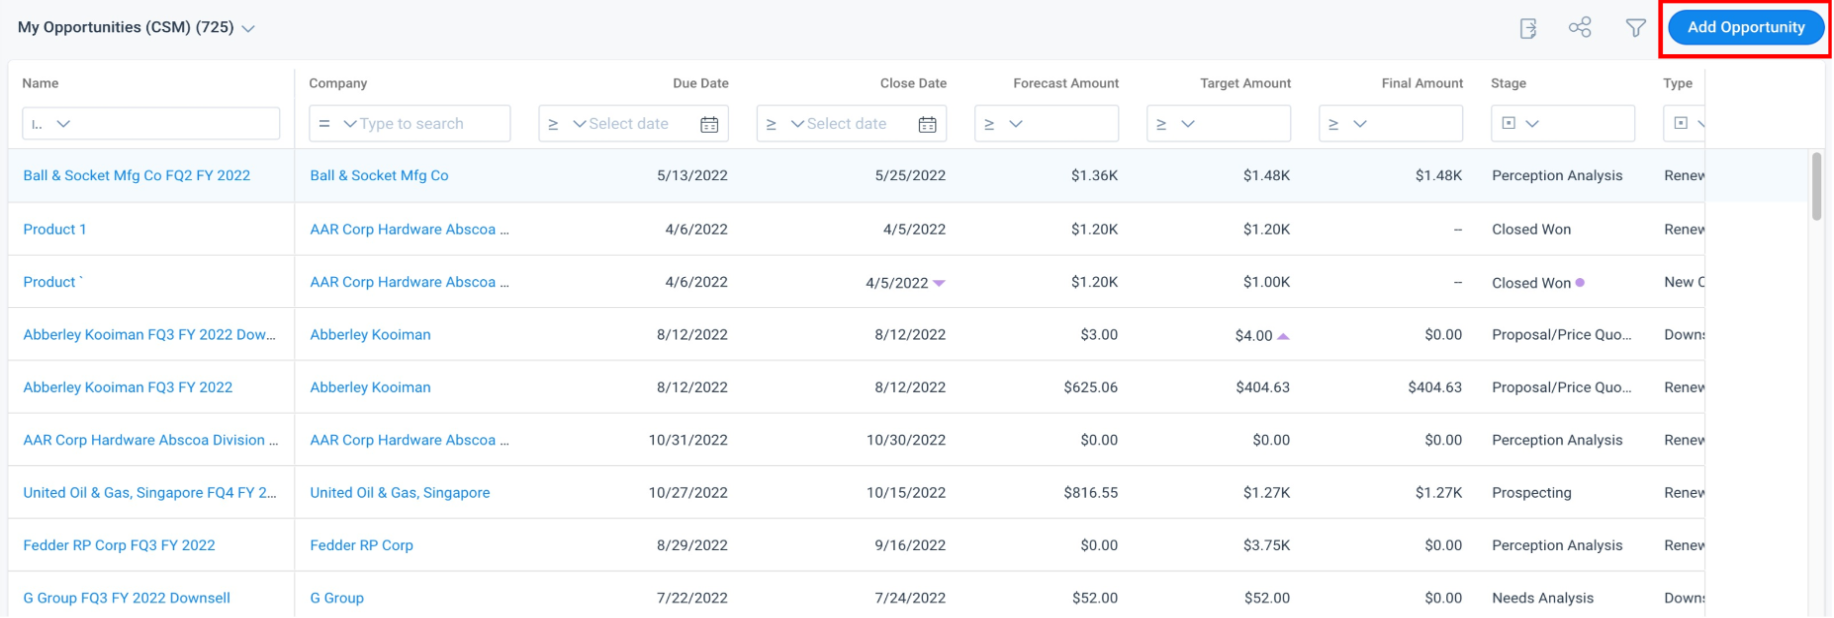
Add New Opportunities
You can add new opportunities from the Forecast section. The fields configured by your admin in the detail view page are displayed on the new opportunity page.
To add a new opportunity:
- Click Add Opportunity.
- Add the following information in the mandatory fields:
- Name: Enter a name for the opportunity.
- Stage: Select a stage for the opportunity.
- Close Date: Select the date on which the opportunity must be closed.
- Opportunity Owner: Select an owner for the opportunity.
- (Optional) Add data to other non-mandatory fields.
- Click Create.
Notes:
- If the newly created Opportunity belongs to another quarter, you cannot view it from the current quarter. You must switch to the respective quarter to view the newly created Opportunity.
- Inactive picklist values will not be visible in search results while adding or editing opportunities. It is applicable to Opportunity Owner, Opportunity Type, Stage, Forecast Category out of the box fields and other custom picklist values.
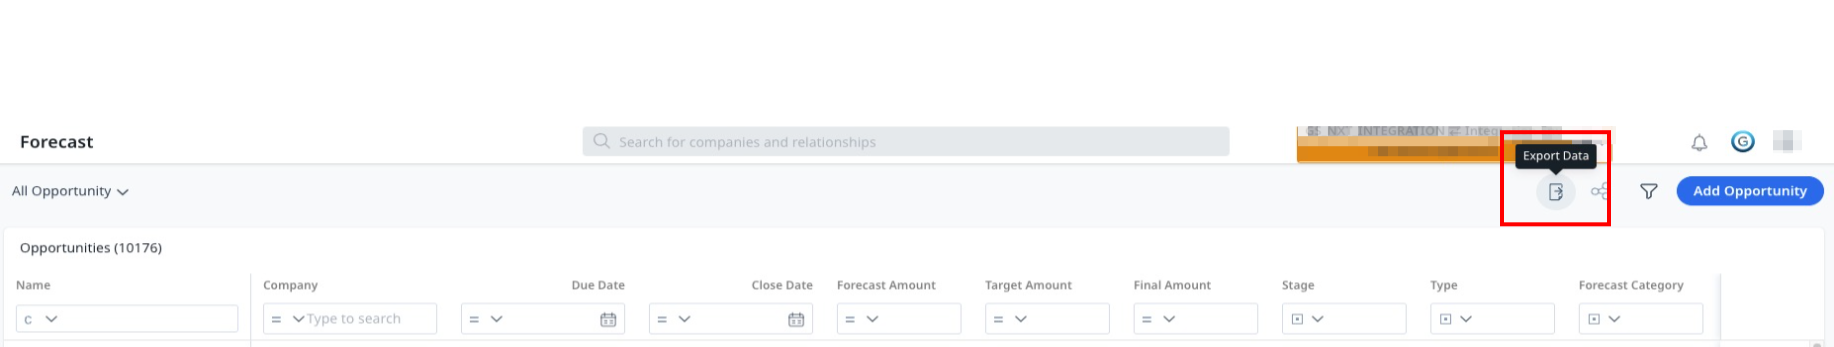
Export Opportunity Data
You can export the Opportunity data as a CSV file by clicking the Export Data icon. The name of the file is export.csv.
Link Opportunity to Cockpit CTA
Renewals offer the ability to link an opportunity to Cockpit CTAs so that the CSM can take proactive targeted actions to close an opportunity.
This feature allows a CSM to:
- Create a new GS Opportunity and link it to a CTA .
- Link an existing GS Opportunity to a CTA directly from Cockpit.
- Use Rules Engine to identify GS Opportunities that need action and create CTAs link them automatically to the Opportunities.
Prerequisites
- Renewal Center must be purchased as an add-on and enabled in your tenant by Gainsight.
- Admin needs to have the data permissions required to access GS Opportunity.
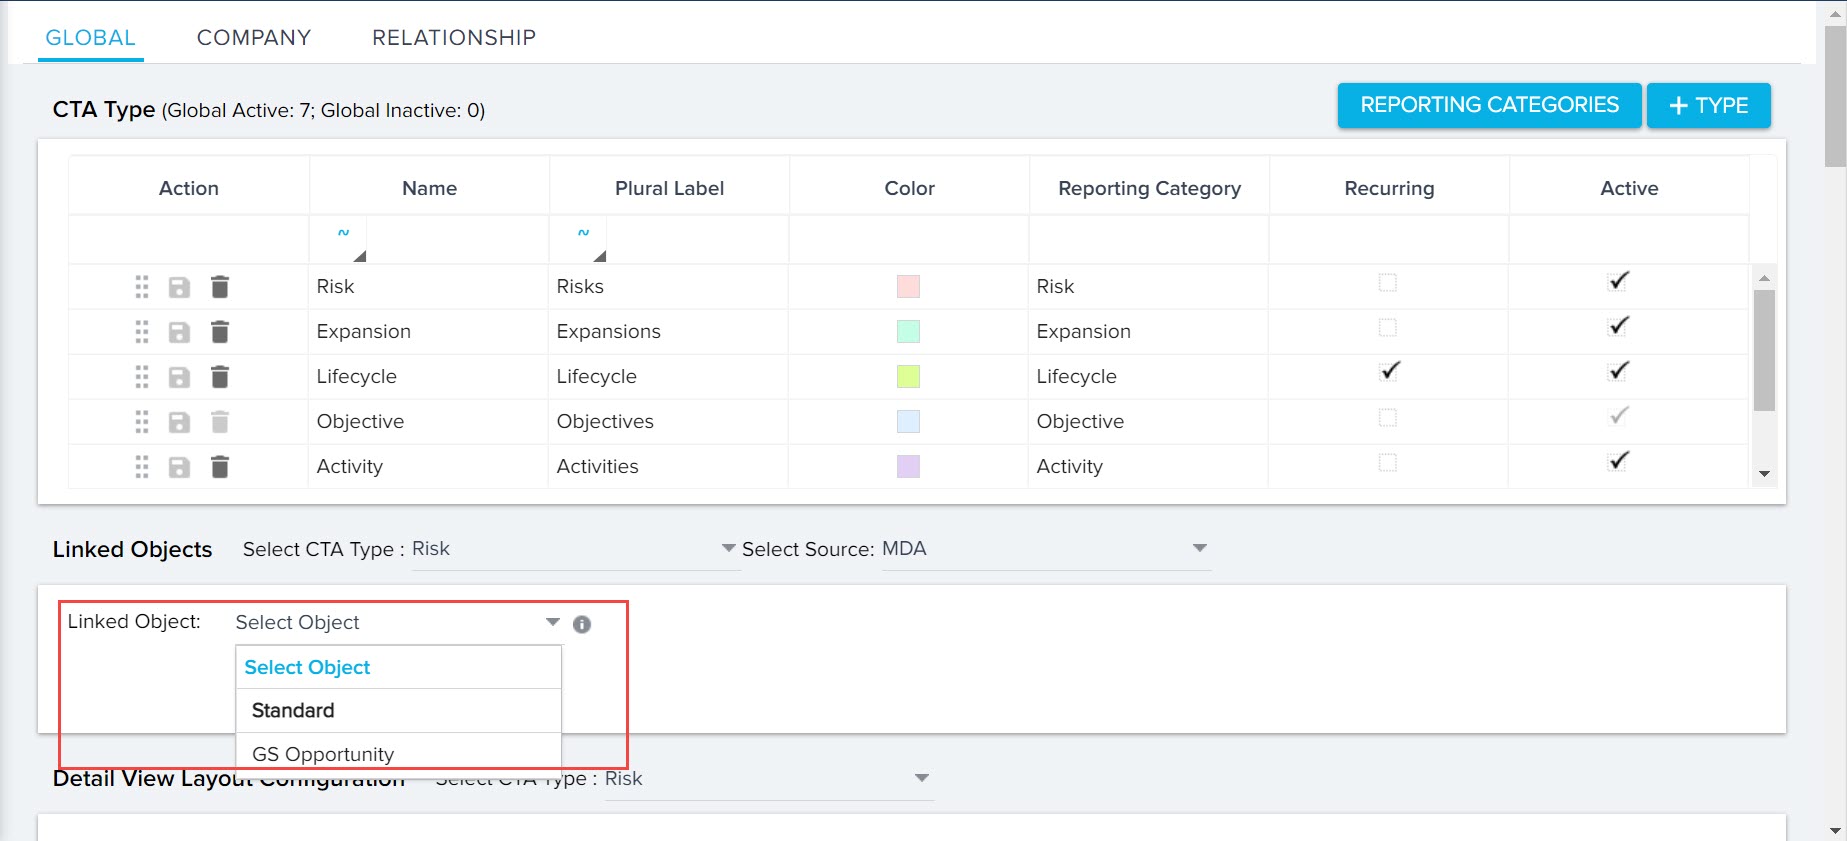
Configure Opportunity Object
To link Cockpit CTAs to GS Opportunity, you need to configure the required CTA type with the GS Opportunity object. To perform this, navigate to Administration > Cockpit > Call to Action and then select the required CTA type and Linked Object as GS Opportunity.
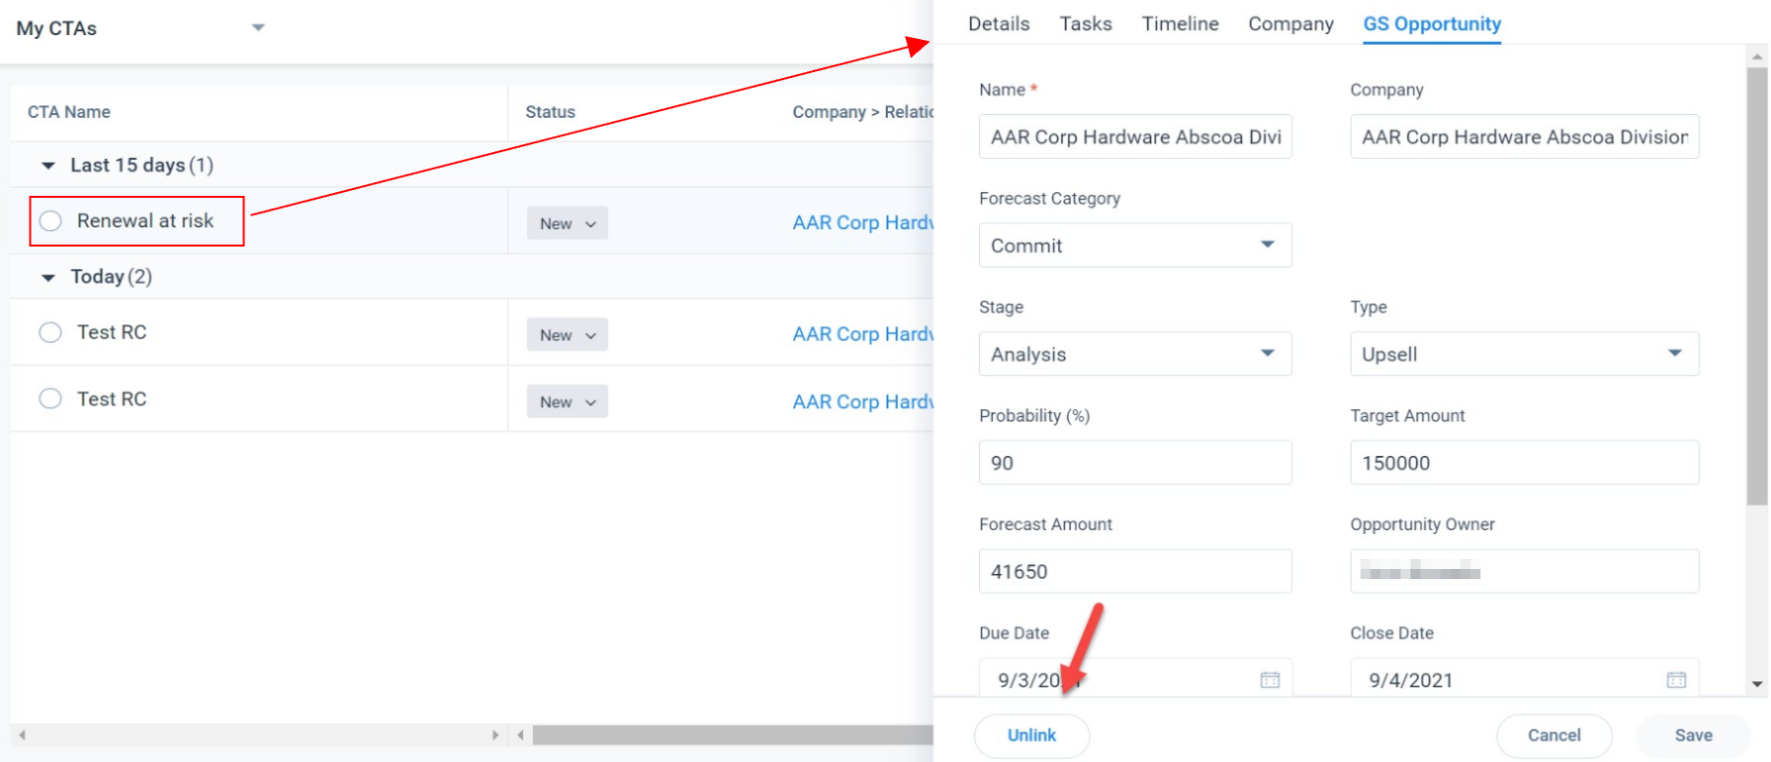
Link or Add Opportunity
To link an opportunity, click any CTA, click the GS Opportunity tab select from the options Link Opportunity or Add Opportunity.
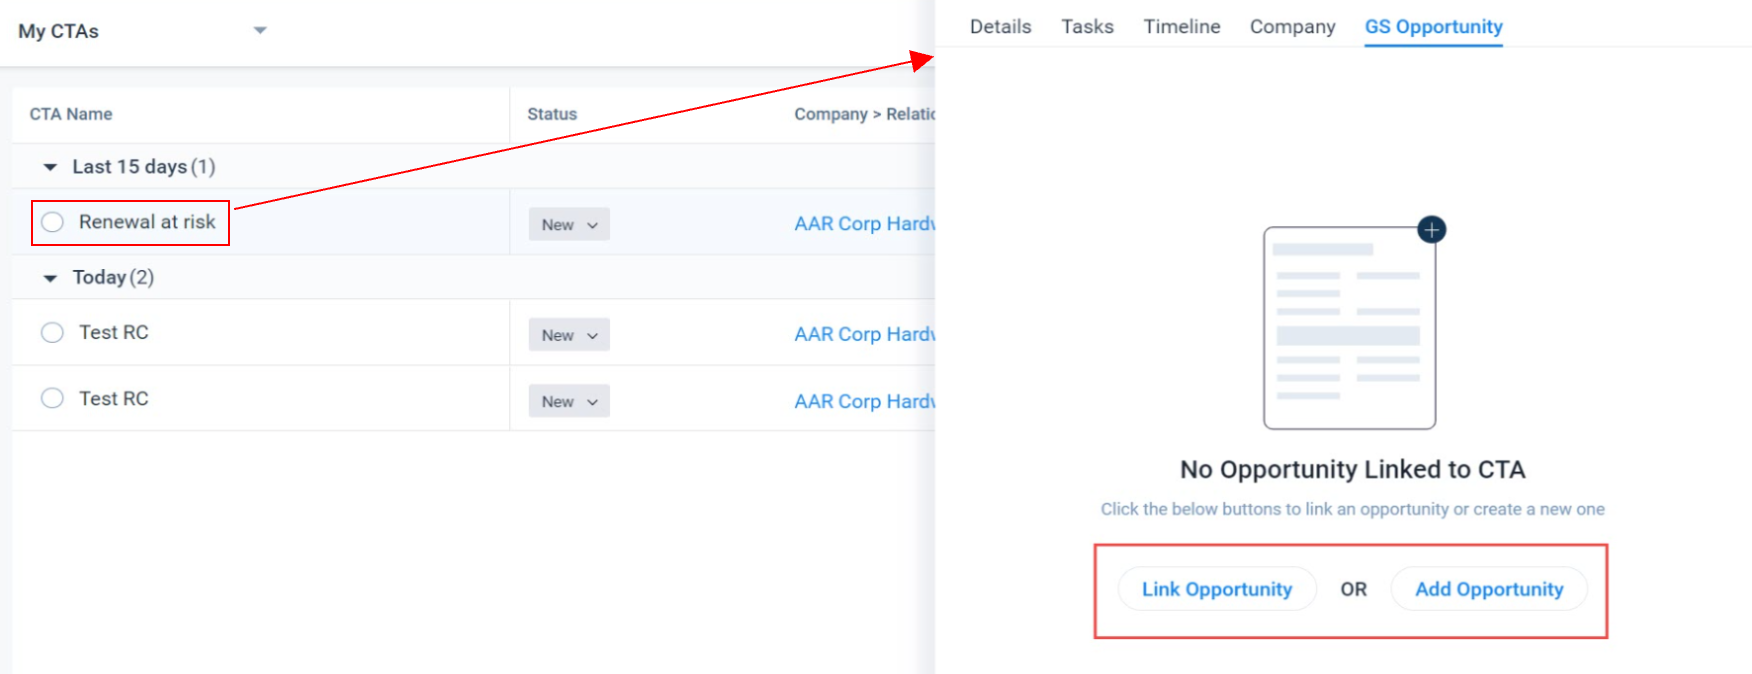
Note: You can unlink an opportunity if the configuration is no longer required.