Object Analyzer Admin Guide
Gainsight NXT
Object Analyzer scans all the Objects in your instance and provides insights to improve performance.
Perform the following steps to use Object Analyzer:
Navigate to Administration > Analyzer > [click on the Object Analyzer icon on the left].
Dashboard
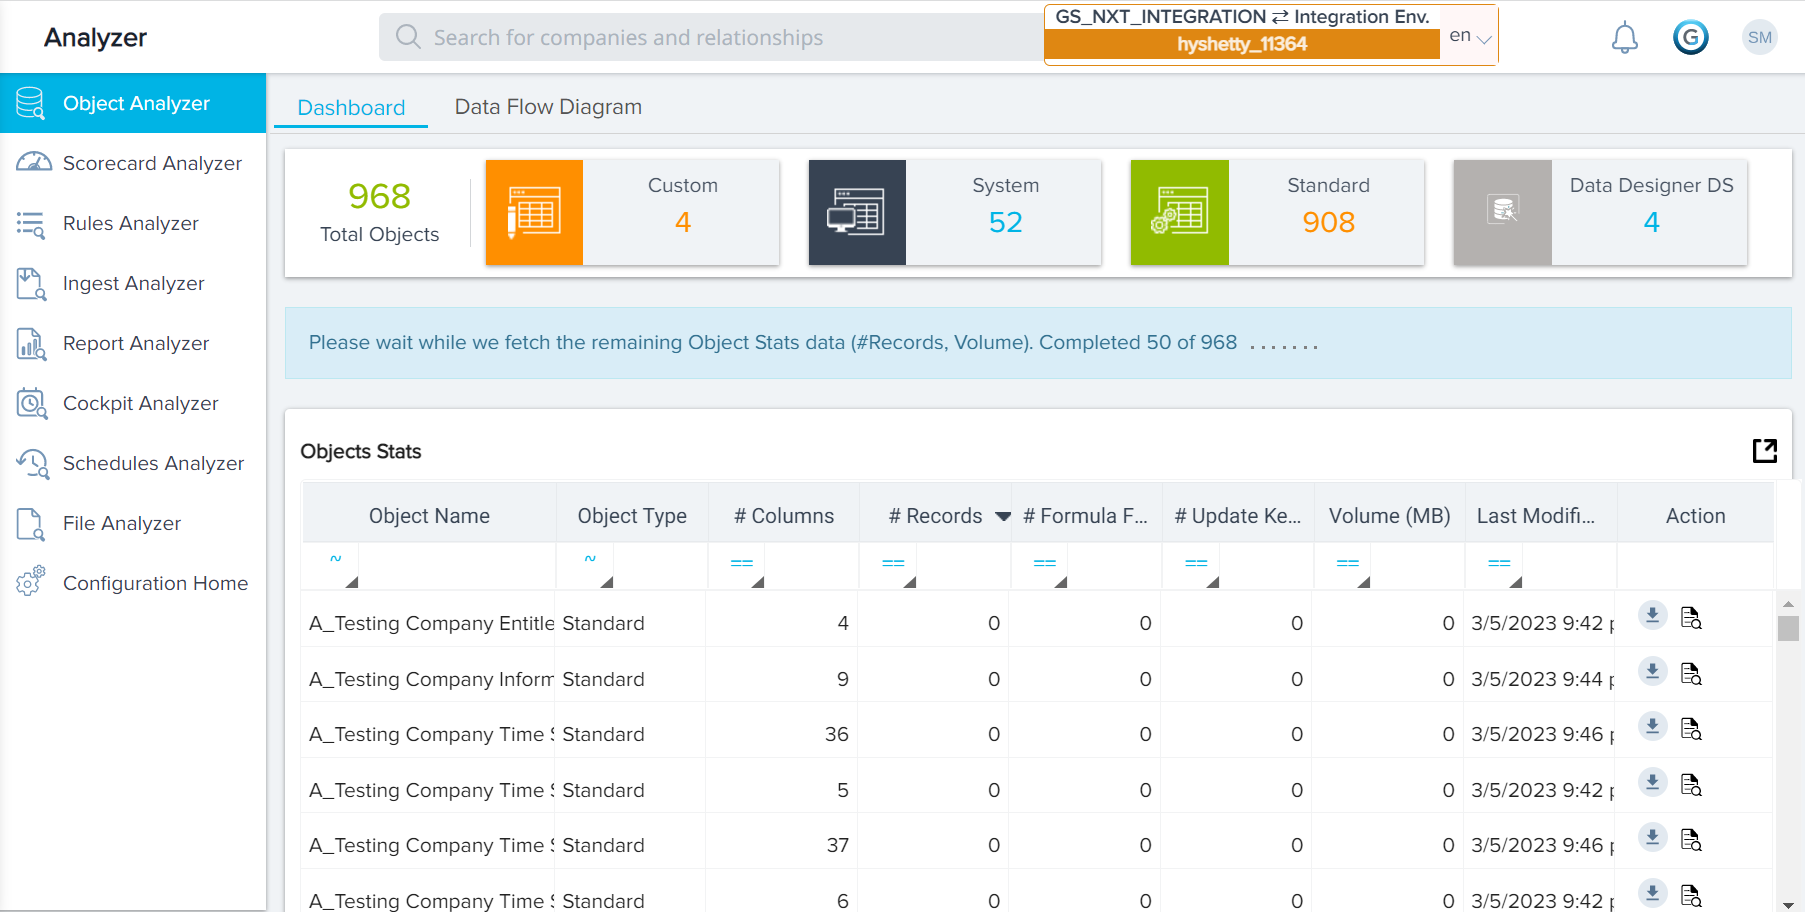
The DASHBOARD tab displays the Object Analyzer Dashboard screen with a quick view summary of all the Objects arranged in tiles at the top of the screen, including the number of Custom Objects, number of System Objects, and number of Standard Objects in the Org. The dashboard contains sections on object stats, high volume objects, custom objects, and recommended features.
Object Stats
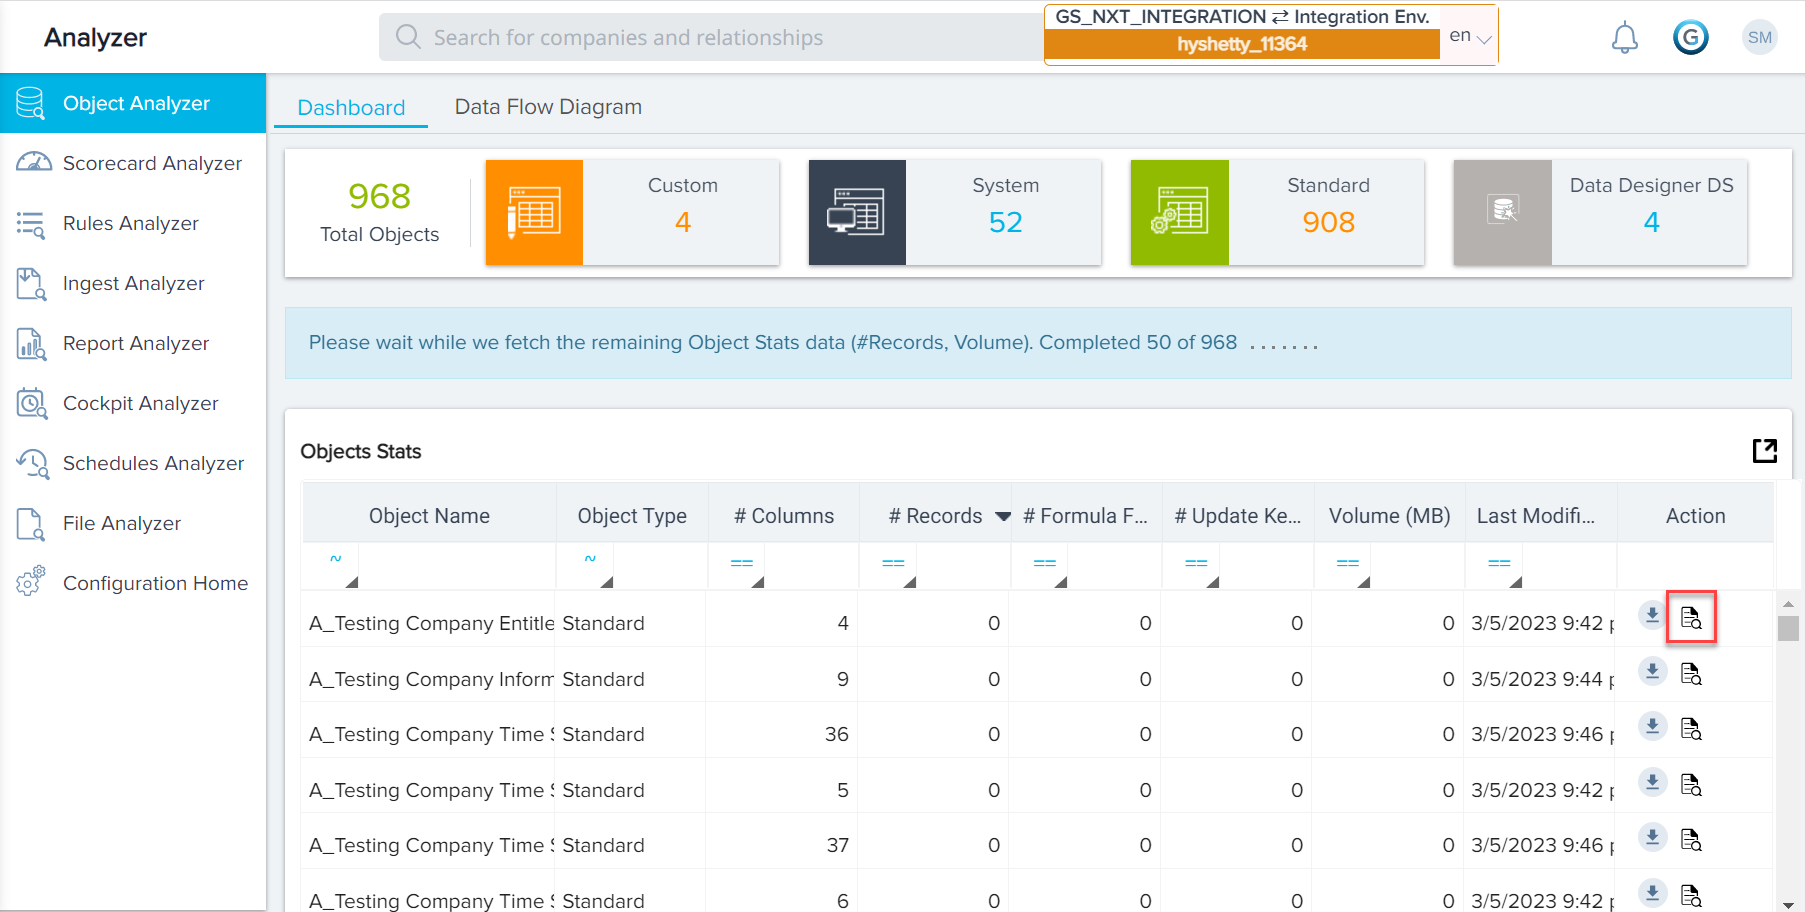
The analysis of the Objects appears under the head Object Stats. This contains the list of Objects, Type, Number of Fields, Number of Records, Formula Fields, Update Keys, Volume utilized in MB, and the last modified date of the object, and a Scan icon. You can click on the Scan icon ( )present at the end of the row to see a complete analysis of a particular object.
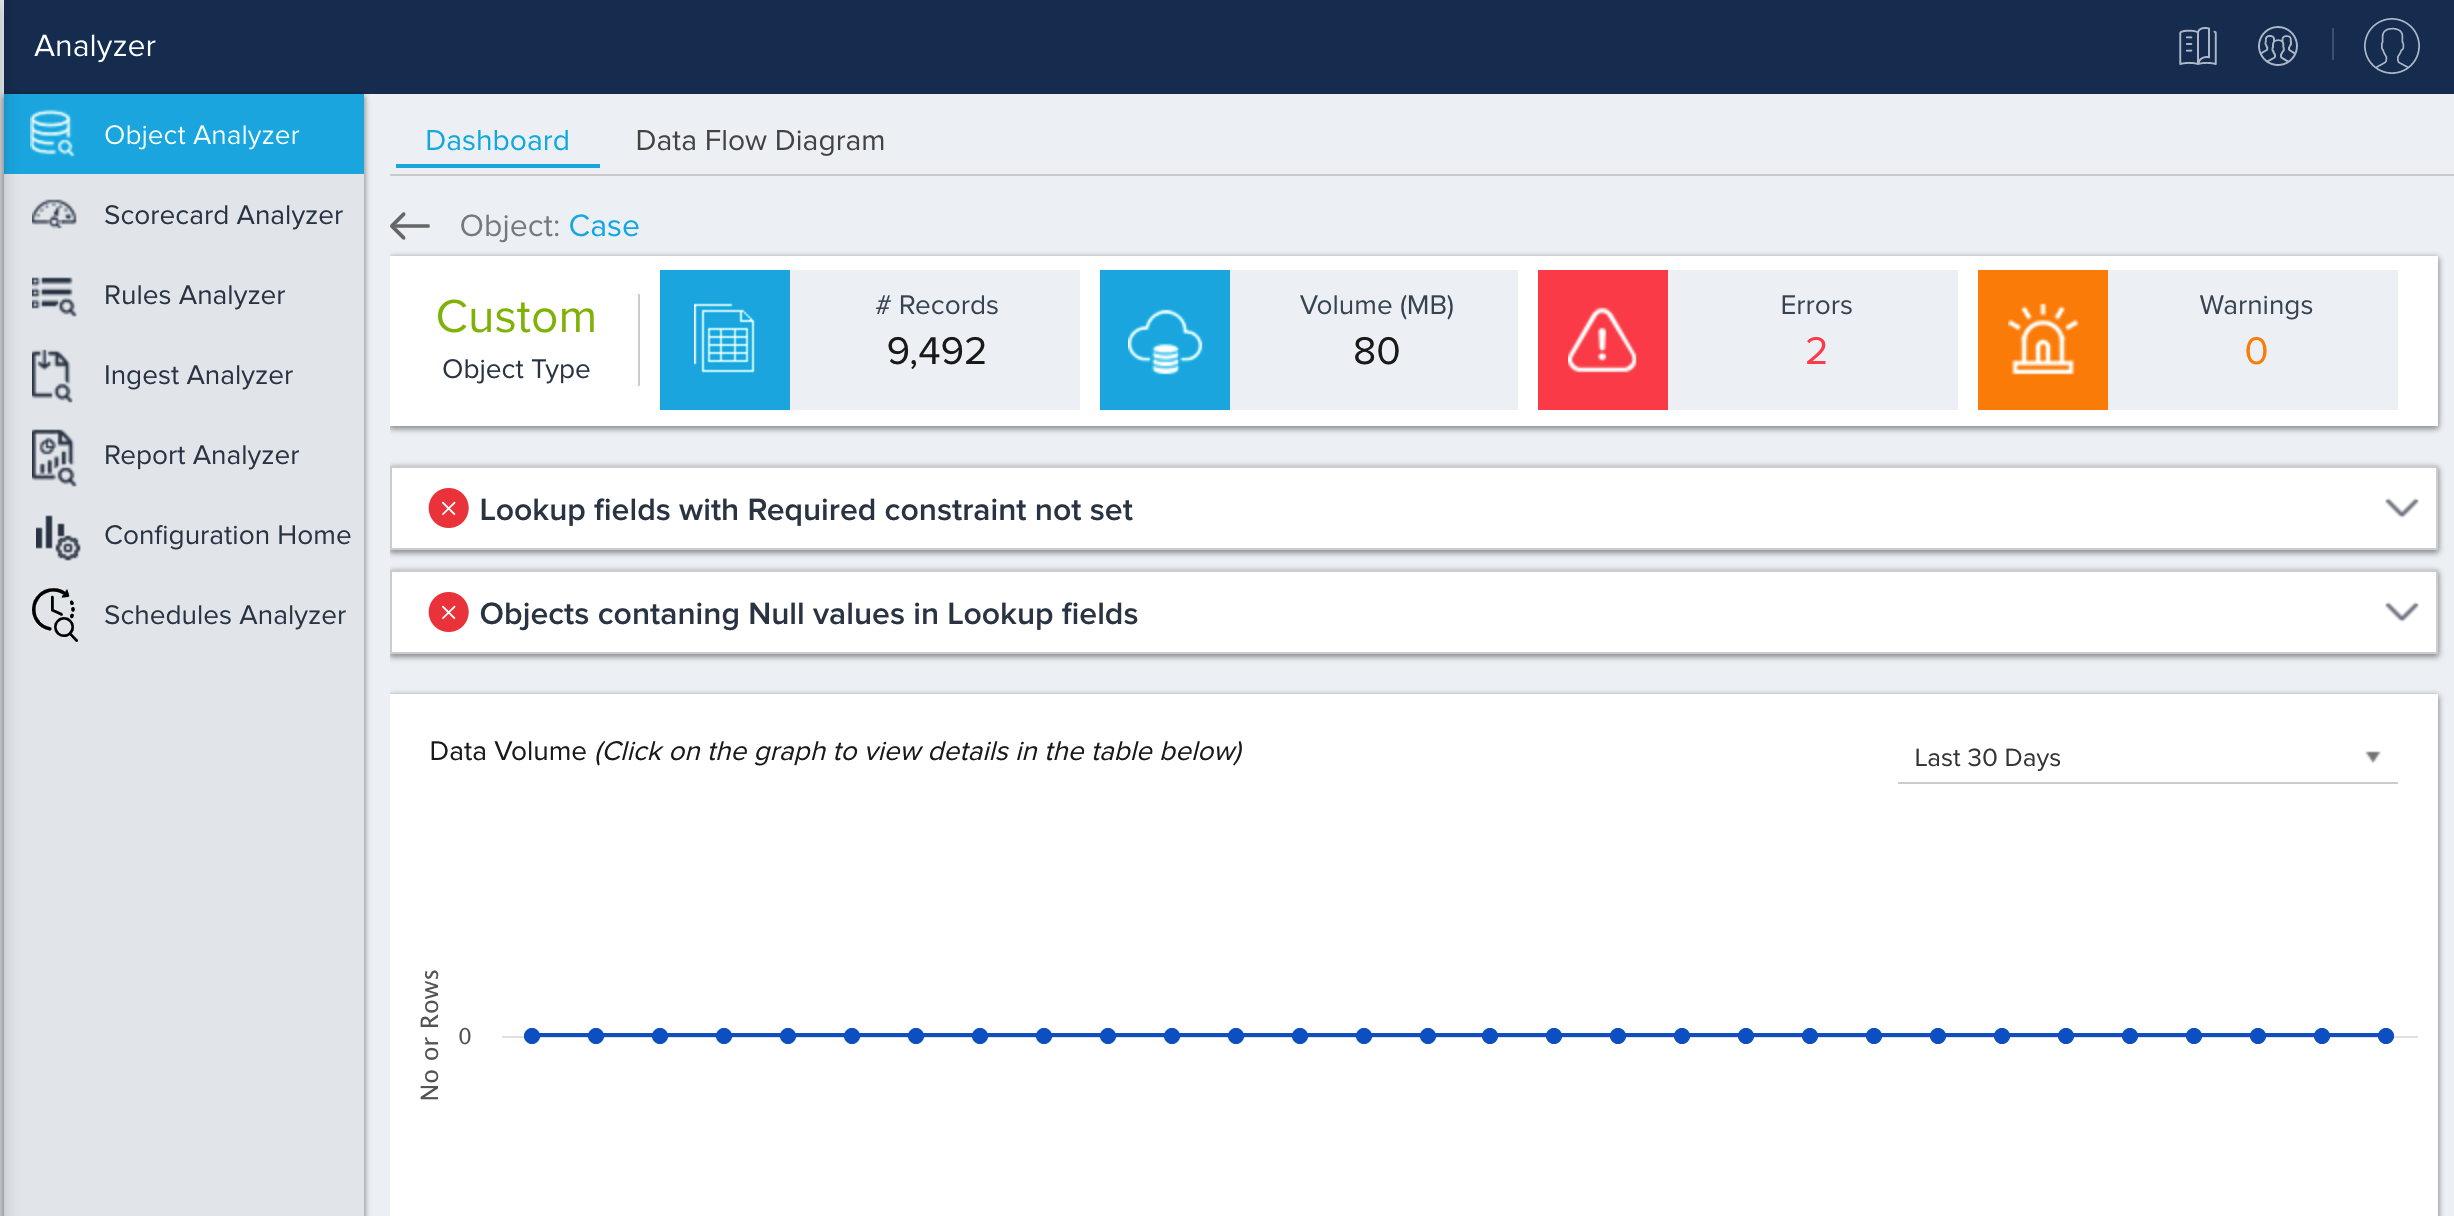
Clicking on the Scan icon displays a window that provides a detailed report on the particular object, including the Object Type, Number of Records, Number of Live Records, Volume, Errors and Warnings. If the Object’s performance can be optimized further, a Warning is displayed which defines the improvement area. A Data Volume graph is also displayed, which illustrates the number of rows of data within the object over time.
In the following image, the Analyzer warns that the Object contains lookup fields that do not have required restraints configured, as well as lookup fields that contain null values. The Data Volume graph is also displayed.
Object Warning/Error Messages
The table below lists every possible Object Analyzer warning/error message.
|
Warning/Error |
Detail |
Scan Type |
|---|---|---|
|
Objects with no records |
The object doesn't have any records. Delete objects which are not in use. |
Warning |
|
High volume objects |
The object has more than 10 Million records. Archive data beyond 1 year to improve performance. |
Warning |
|
Objects not being utilised |
The object does not have active rules or reports defined on top of it. Delete it if it is no longer required to reduce clutter and improve manageability. |
Warning |
|
Objects with large number of fields |
The object has more than 100 fields. Model the object to multiple objects with logical grouping of fields. |
Warning |
|
Objects with more number of Formula field |
The object has more than 10 formula fields. Use bionic rules to compute formula fields unless on the fly calculation is required, it will improve the performance while reporting on the data. |
Warning |
|
Lookup fields with Required constraint not set |
The object has Lookup fields but doesn't mandate the values to be required. It is recommended to set a required constraint on fields with MDA join to restrict null values from being inserted. |
Error |
|
Objects containing Null values in Update fields |
The object has Nulls in Update keys. Remove null values from Update keys to maintain data quality. |
Error |
|
Objects contaning Null values in Lookup fields |
The object has Nulls in Lookups fields. Remove null values from Lookup fields to maintain data quality. |
Error |
|
Objects containing duplicate records |
The object has row level duplicate records. Delete the duplicate records in the object to maintain data quality. |
Error |
|
Objects containing duplicate values in Update keys |
The object has duplicate records in Update fields. This would affect MDA Joins. Remove duplicate values from Update fields. |
Error |
|
Object with frequent updates and deletes |
The difference between the number of rows that are actually in the table and logically represented by the system is huge. Consider the updates that are happening on this object. |
Warning |
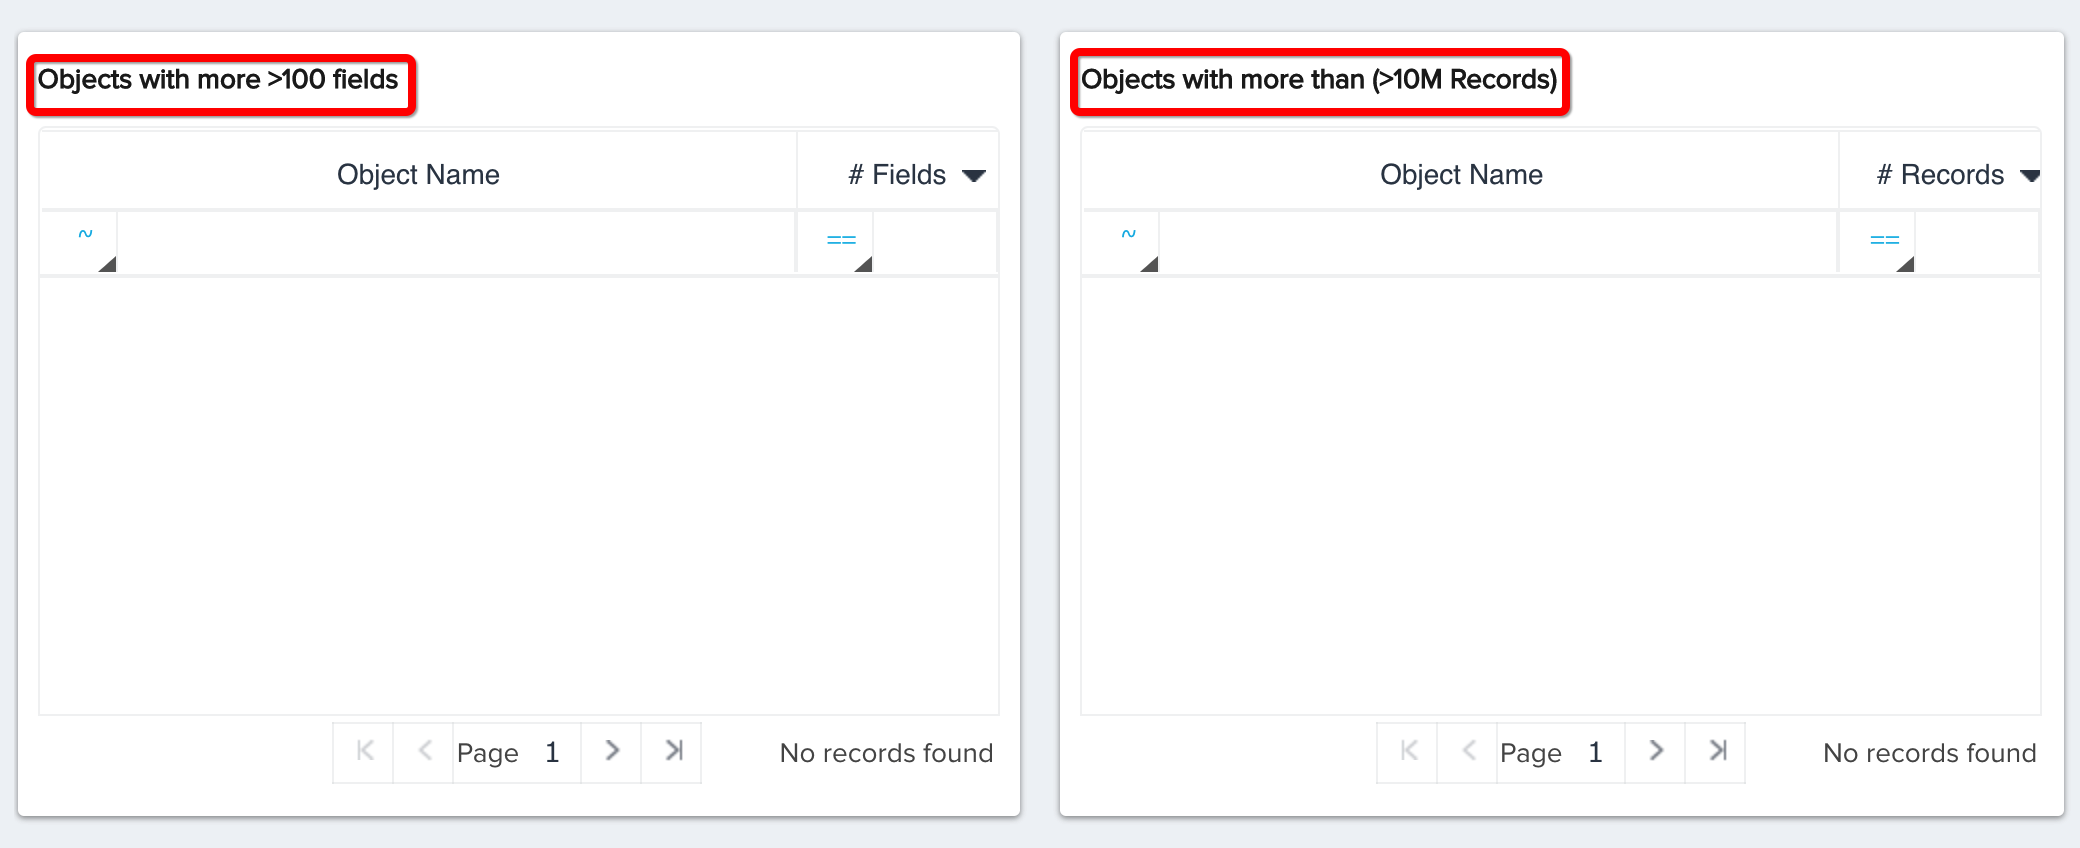
Objects with High Volume Fields and Records
The section labeled Objects with more >100 fields lists out objects that have more than 100 fields, and the section labeled Objects with more than (>10M Records) lists out objects that have more than 10 million records.
Note: This section calls the attention of the User to high volume Objects to facilitate quick action if required.
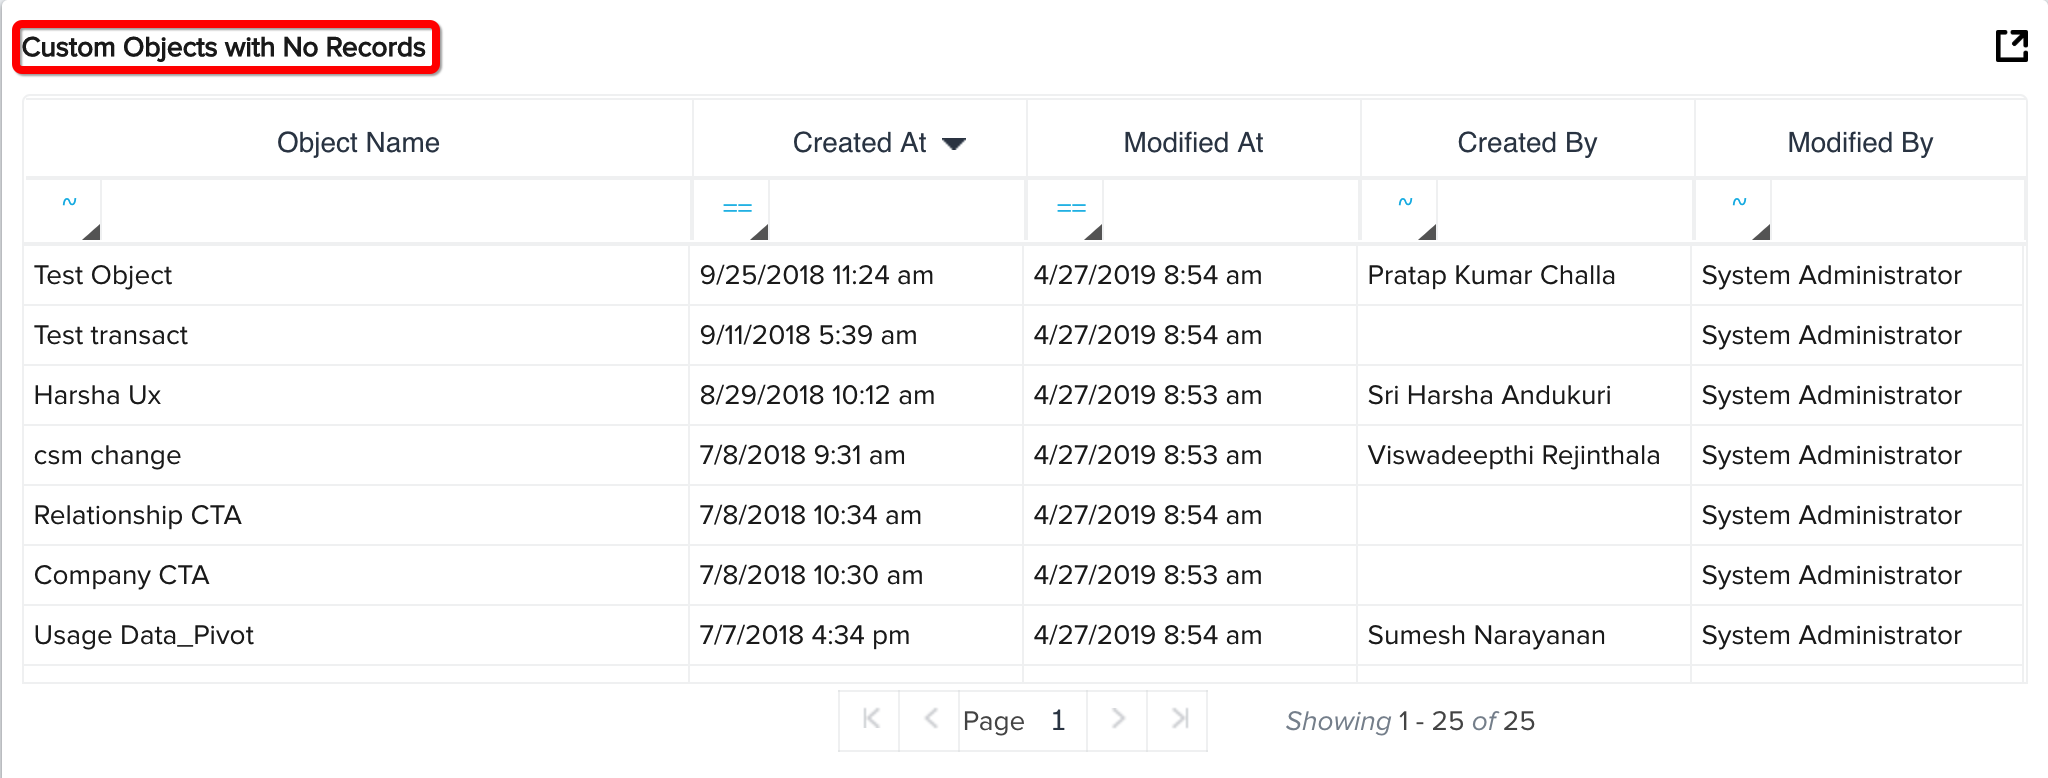
Custom Objects with no Records
This section displays Custom Objects that do not have any records and lists out Objects that have no records along with the date of creation. Admin can improve manageability by reviewing stale objects and deleting them.
Recommended Features
The Recommended Features section contains a list of recently released features which have not been used even once. You can click on any available recommended feature to navigate to the product documentation about the feature.

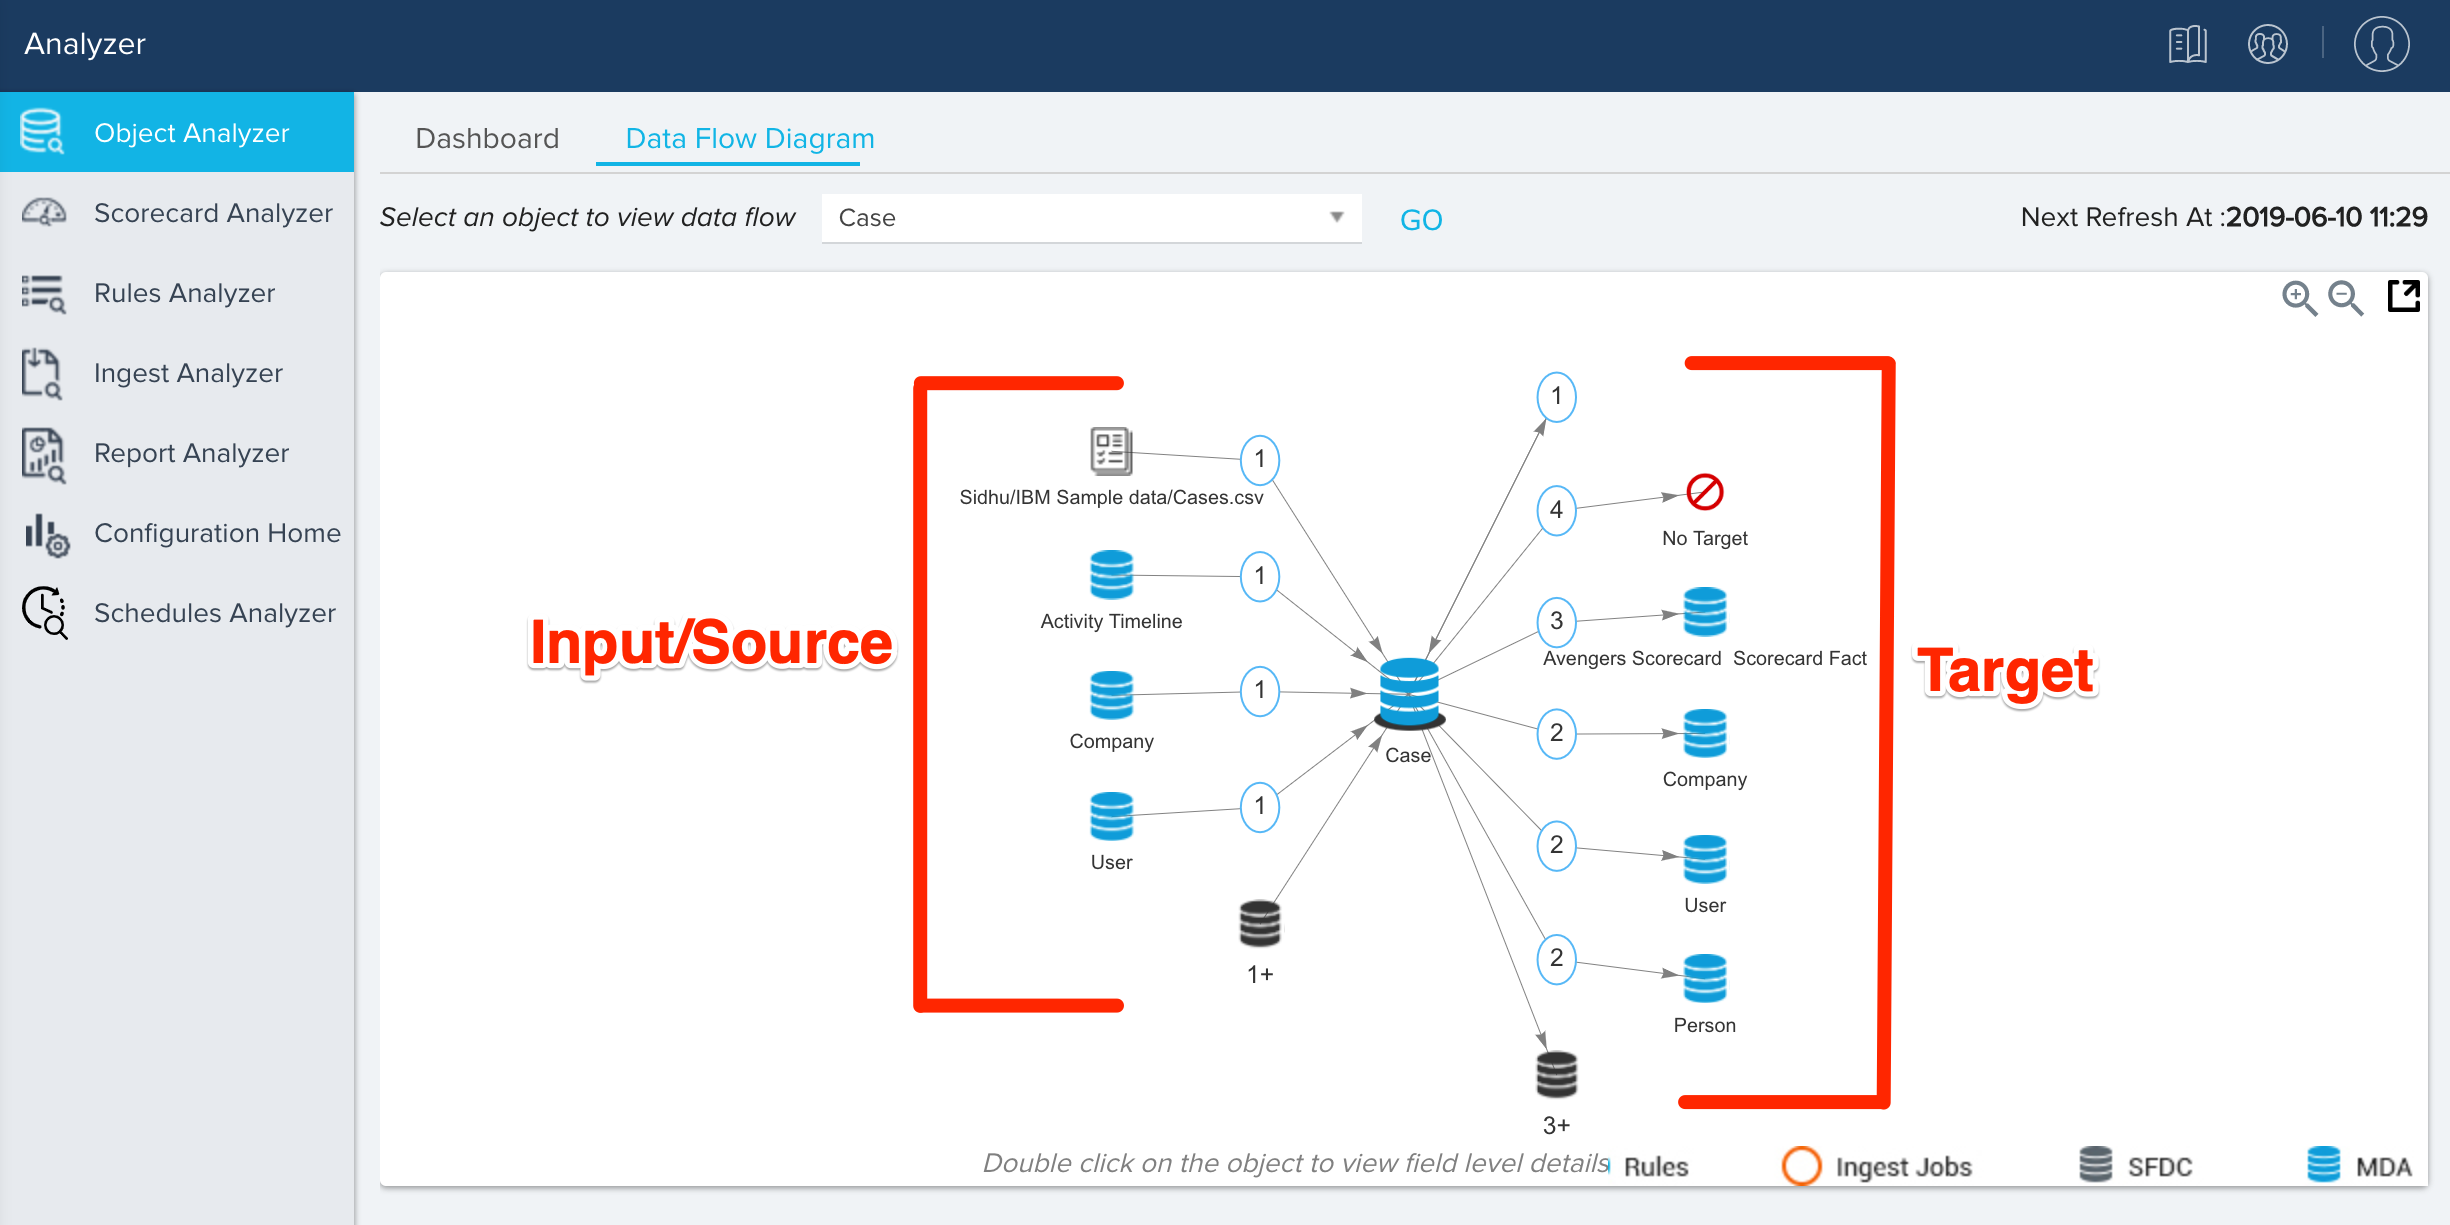
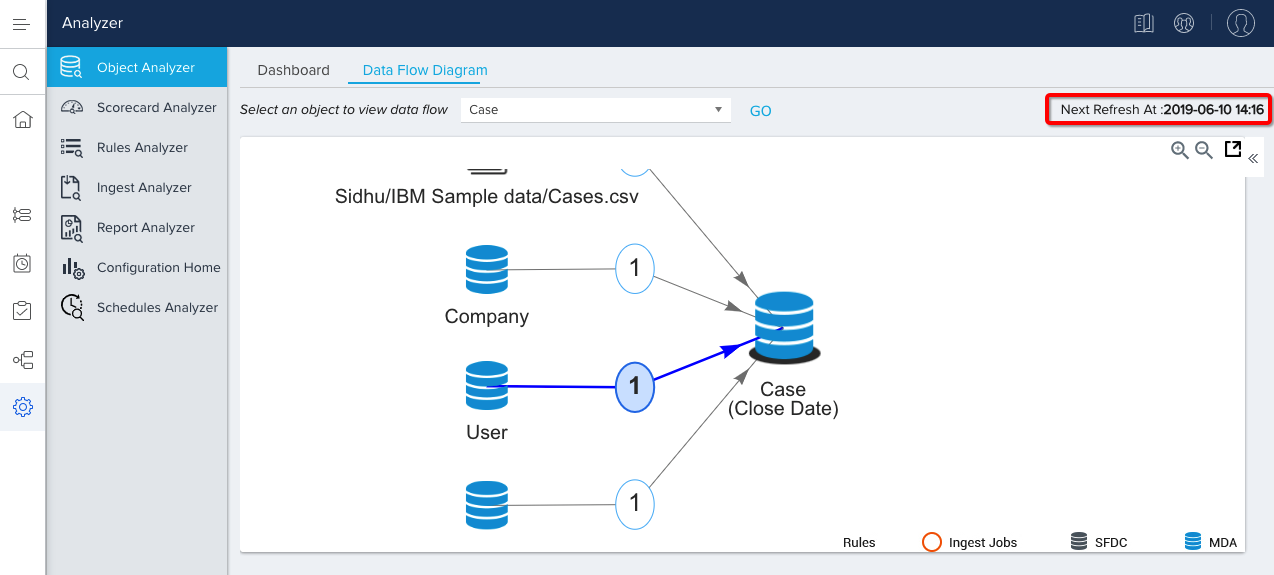
Data Flow Diagram
The Data Flow Diagram helps you analyze how data flows through various objects. It shows the source and target rules / Ingest jobs reading or writing to an object in a pictorial format.
Use Data Flow Diagram
This feature enables admins to perform an instance review or diagnose a data quality issue and finally create configuration documentation quickly.
To use the Data Flow Diagram feature:
-
Navigate to Administration > Operations > Analyzer > Object Analyzer > [Click on the DATA FLOW DIAGRAM tab.]
-
Select an object from the dropdown list to view data flow.
-
Click GO.
Note: After clicking GO, the system will take time to process drawing the diagram.
-
Click on a process icon (blue circle in the following image). This displays a table below the diagram, that gives details about the process used to move data from one area to another.
-
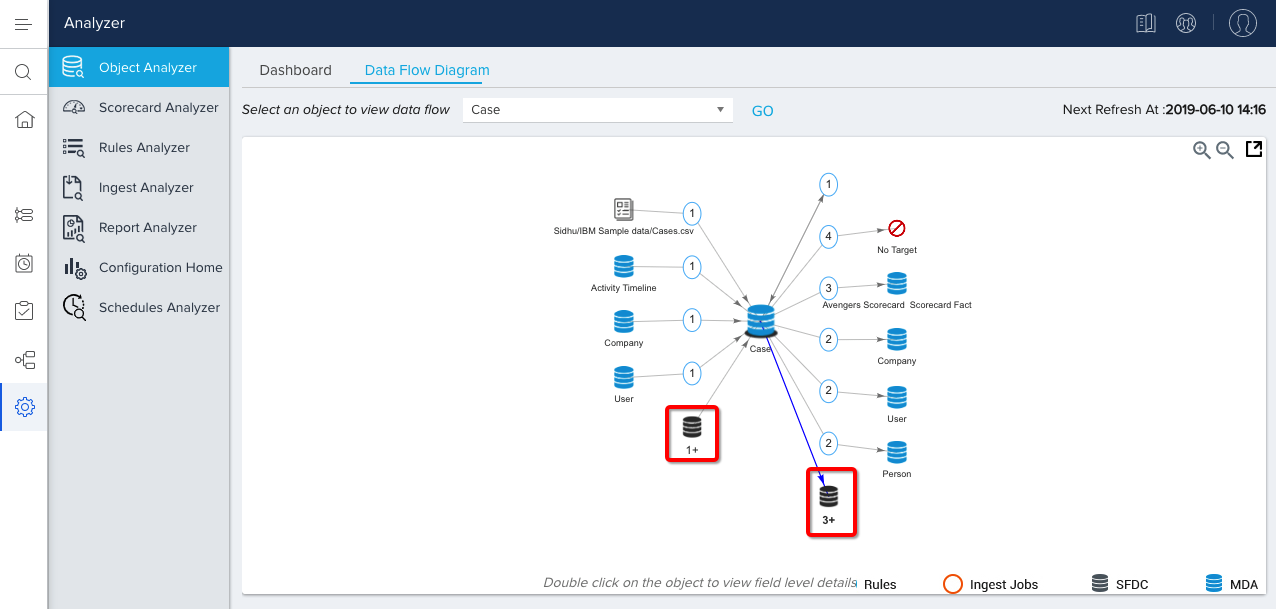
If there are more than five sources/targets "X+ "objects will be shown in the diagram. Click on X+ to view the details on the table below the diagram
-
Double click on the SFDC/MDA object icon (
 /
/  ) to navigate to the Data Flow Diagram of that object.


-
Click on the
 icons to export the Data Flow Diagram and also the rules in excel format.
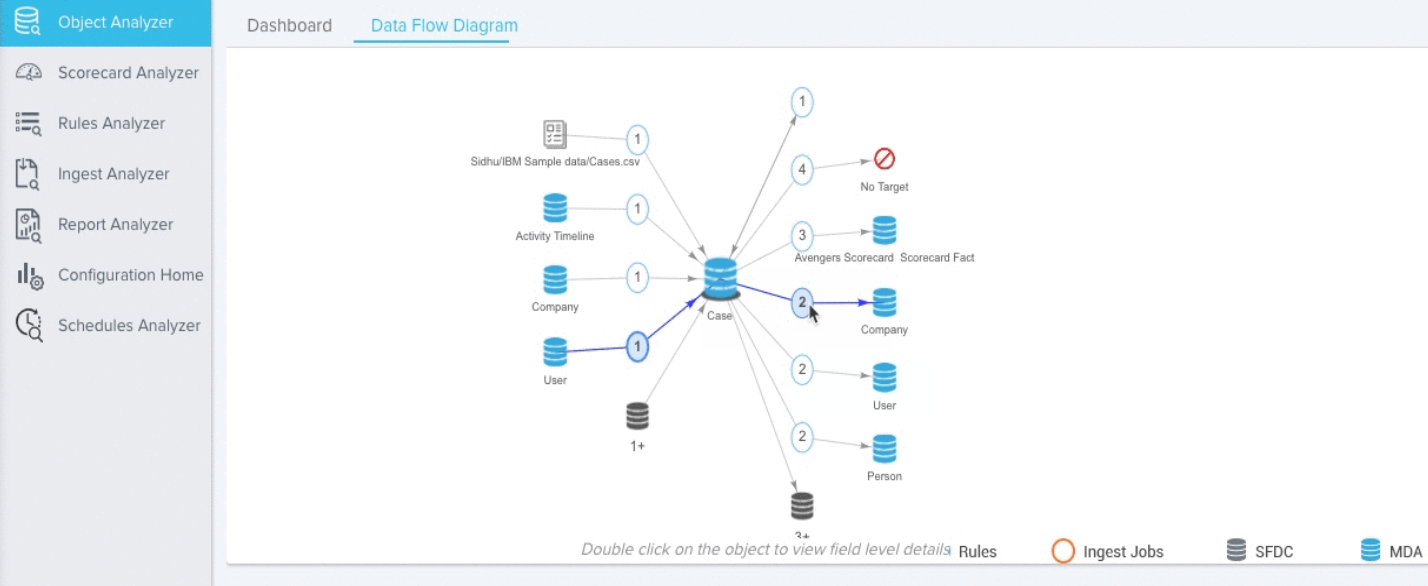
Data Flow Diagram at Field Level
This feature enables admins to perform an instance review, diagnose a data quality issue, and finally create configuration documentation quickly. To use the Data Flow Diagram at the Field Level, take the following steps:
-
Navigate to Object Analyzer > Data Flow Diagram.
-
Select an object.
-
Click GO.
-
Double click on the object to view the list of fields.
-
Select any field to redraw the diagram to show the data flow of the specific field.
-
Click on the process icon to display the details of the field’s data flow.
Note: Clicking the process details for any field displays a table that includes the information about the field and how it is used in each rule. For example, a field can be used as part of the Show Field, Action, or Merge etc.
Limitations
-
Only active rules are displayed.
-
Usage Connectors and Case connectors are not yet supported in the Data Flow Diagram.
-
There can be a data delay of up to 1 hour at maximum - Next refresh time is shown on the top right corner.
Information: The data flow is basically one or more datasets created based on the data from Salesforce or MDA objects. A data flow is a set of instructions that specifies what data to extract from Salesforce/MDA objects, how to transform the datasets, and which datasets to make available for diagrams.