View Shared 360 for Gainsight Product Adoption
Gainsight NXT
Overview
Gainsight customers can view their organization's Gainsight product usage data directly in their Gainsight instance. Our goal is to help our customers better understand how their users are utilizing the Gainsight application. Along with product usage, customers can have visibility into their license counts, deployment % and support ticket data from one location.
Gainsight measures customer adoption data and displays it on the Shared 360 page. This article explains the data displayed in each section of the Shared 360 page and is used by customers that receive our weekly adoption emails.
The Shared 360 of this usage data is a complement to the user and product adoption data reports that Gainsight emails to customers on every Monday.
View Shared 360
You can view Shared 360 page for the Gainsight Product Adoption by clicking the link shared through an email from Gainsight on this context.
Review Data
Following are the sections that you can see on the Shared 360 page for Gainsight Product Adoption.
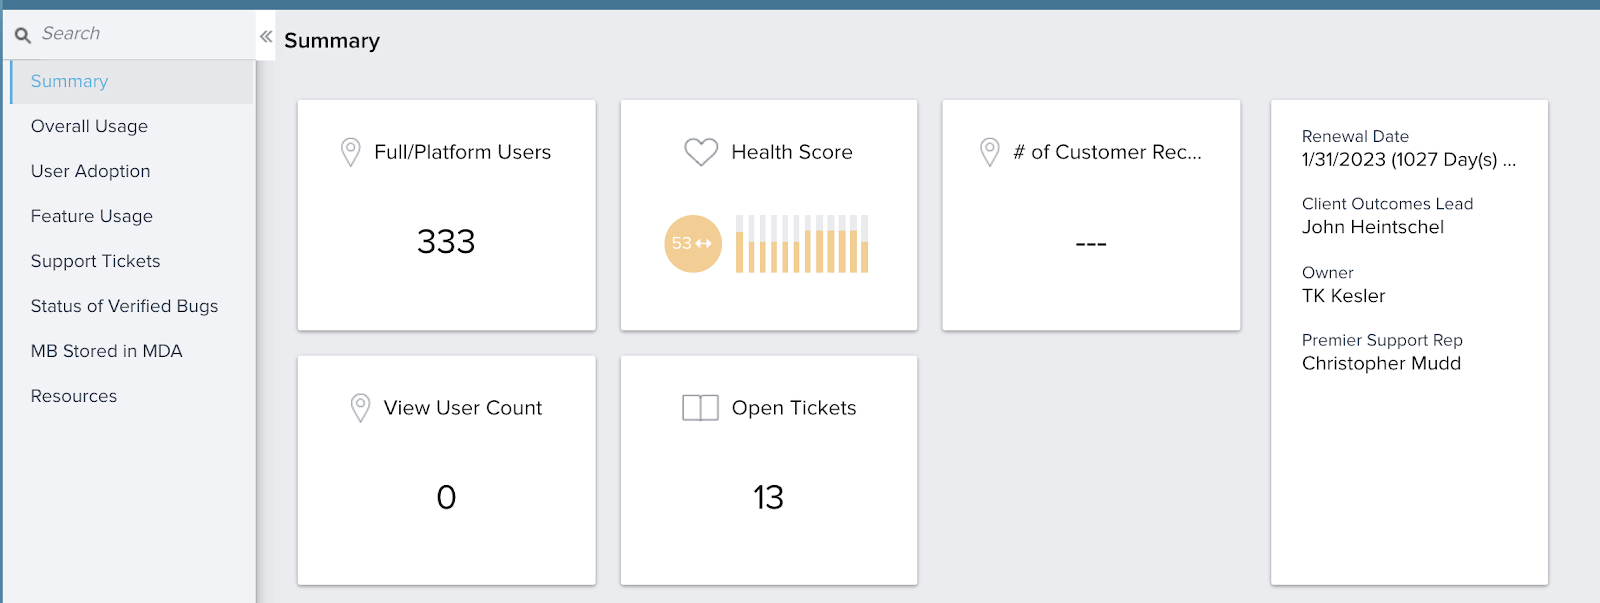
Summary Data
In the summary section, you can find an overview of your relationship with Gainsight, including contract data (license and customer records), your key contacts, and your overall health score from Gainsight's perspective.
Usage Data Sections
Following sections provide greater insights into your company’s usage of Gainsight. You can find data on page views, active users, and specific actions taken by your team. In all the sections, charts are provided that we at Gainsight use internally to measure your adoption of the product and the raw data. All reports are exportable to a CSV and the date range can be modified so that you can perform your own analysis when needed.
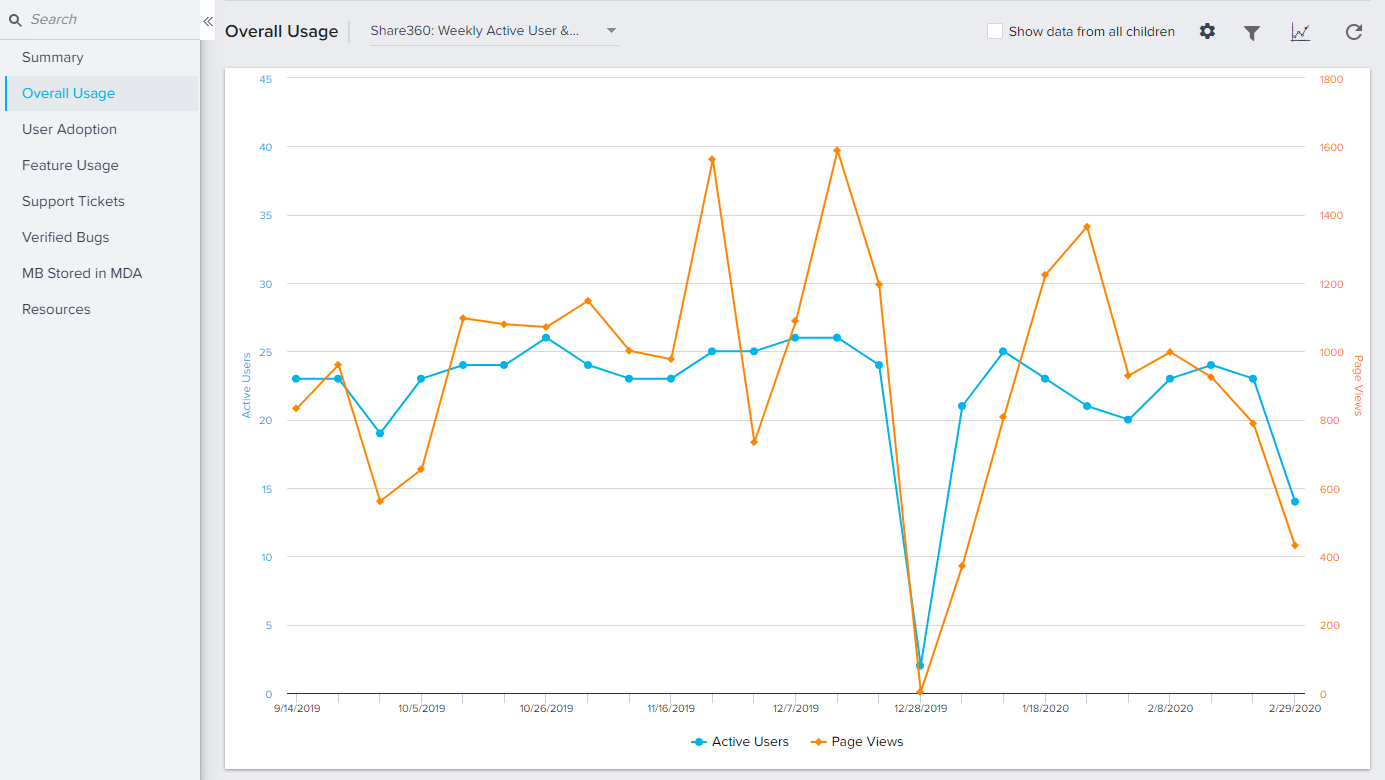
Overall Usage
Reports in this section give you an aggregate view of your overall adoption trends. These reports contain both the weekly and 30 days trends of usage, divided by active users, page views, and actions.
- Active Users: A user that has had at least one login within the specified timeframe.
- Page Views: Any page view within the Gainsight platform.
- Action/Event: Actions taken by a user (Create a CTA, click a button, etc) or performed by an admin on a schedule (Rule runs, Journey Orchestrator email sends, etc).
Usage Adoption
Reports in this section give you insight into how Gainsight thinks about your adoption. Gainsight uses the terminology “Healthy Active User” to analyze the health of each user, and then trend this week over week. These metrics are tied to our “Depth of Adoption” score.
- In addition to overall usage, you'll also find a breakdown of HAUs by individual user-facing features based on our definition of healthy for each.
- Licence Types are included as well, providing a breakdown of users by Full, View, and View Analytics licenses.
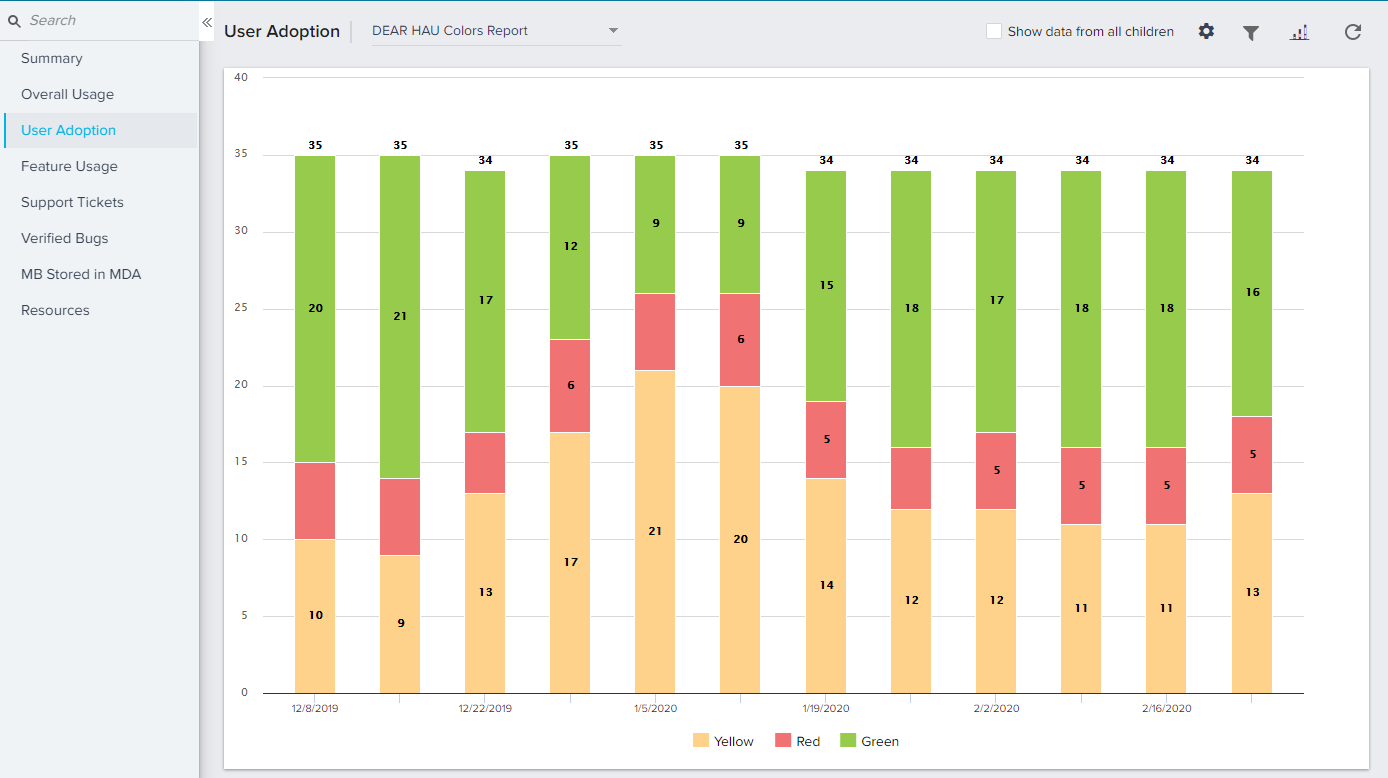
One indication of healthy adoption is a user that relies on Gainsight, weekly (or daily!) as they engage with your customers and drive outcomes. In Gainsight, we track users in 3 categories of activity:
- Healthy Active Users (Green): These are users that have logged into Gainsight 10 times or more in the last 4 weeks. This means at least every other business day.
- Active Users (Yellow): These are users that have logged into Gainsight within the last 4 weeks, but less than 10 times. For these users, we need to identify barriers to adopt more.
- Inactive Users (Red): These are users that have not logged in the last 4 weeks and had at least 1 login in the last 90 days.
In addition to an overall breakdown of HAUs, we’ve included reports that indicate user health by each feature. You’ll find an HAU report for each of our top end user-facing features.
We’ve also included reports to show your top 20 users based on days active and users that are licensed who haven’t been active in the past 4 weeks.
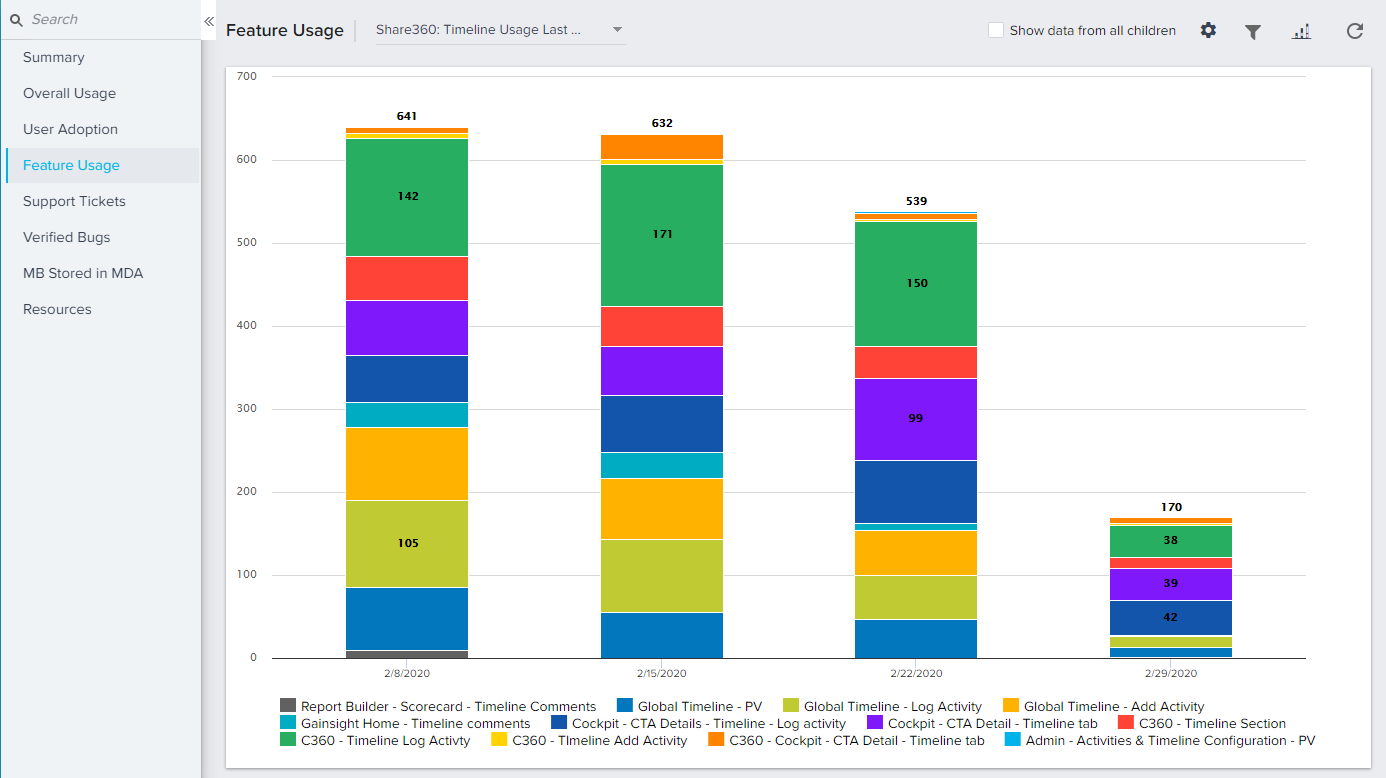
Feature Usage
Reports in this section give a more indepth view into your usage of our top features, that includes the top pages viewed and actions taken by your users.
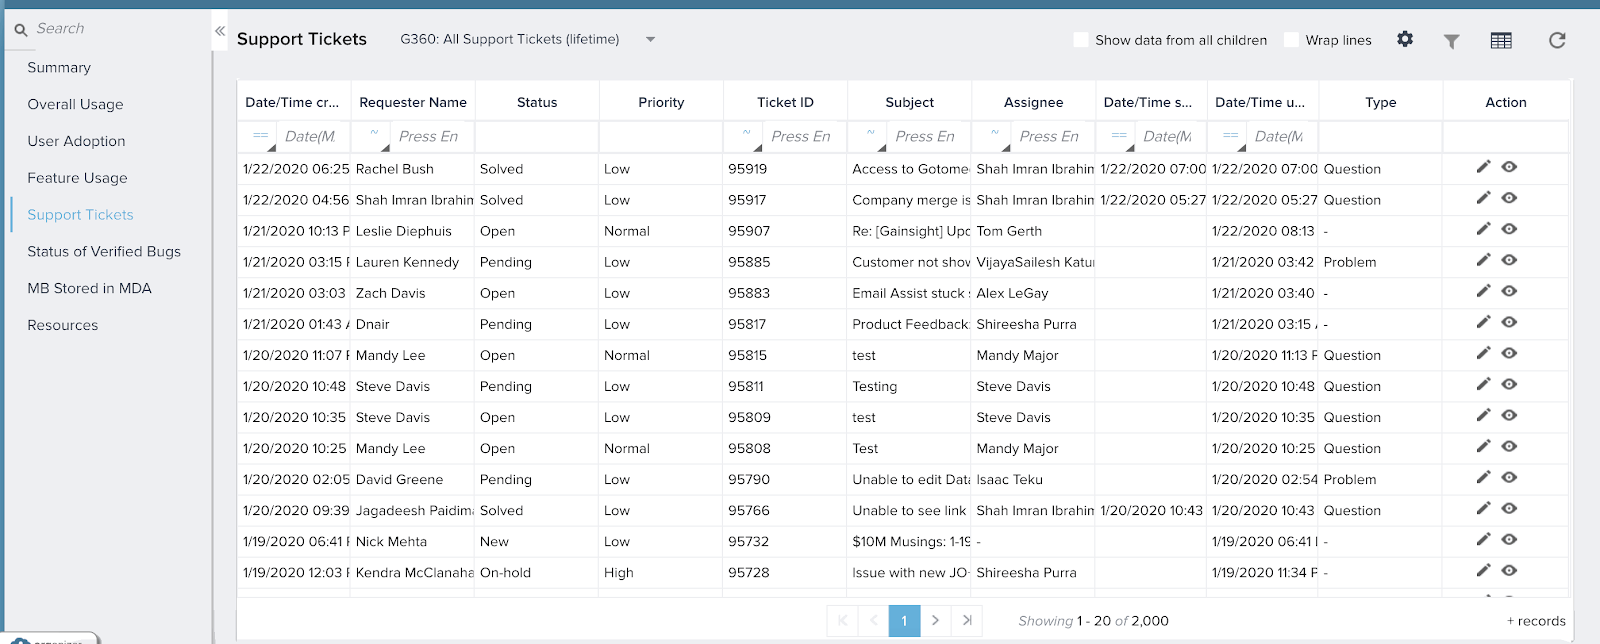
Support Tickets
Reports in this section give you visibility into all of your support tickets broken out by Status.
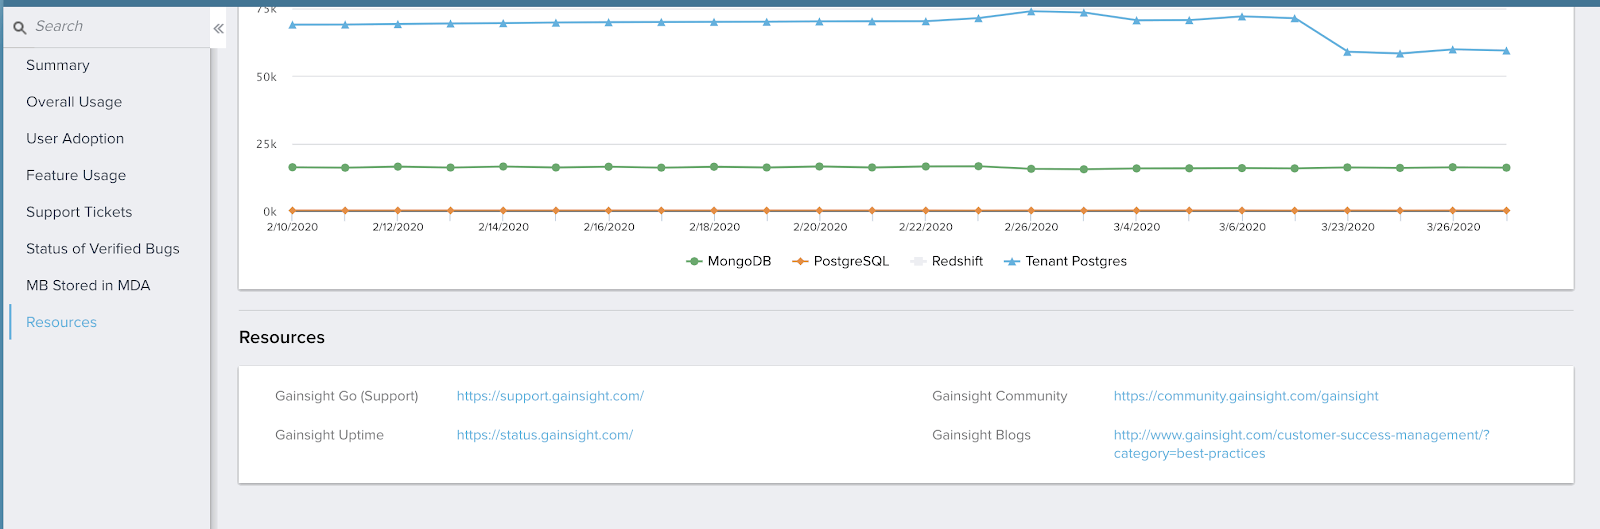
Resources
This section provides quick links to many of Gainsight’s most visited sites, including Support and Community.