Preparation Details in Data Designer
Gainsight NXT
This article walks you through the functionalities in the Preparation tab, and also focuses on how to make use of them while preparing a Dataset for Explore process.
Overview
In the preparation step, you can transform, merge, and union two different objects and create a Dataset. This document explains the functionalities in the Preparation tab, assuming that you have created a minimum of two Datasets on two different objects. For more information on how to create a Dataset, refer to the Create Datasets in Data Designer article.
Following functionalities can be used while preparing a dataset:
- Edit Dataset
- Transform
- Merge
- Union
- Pivot
- Preview Dataset
- Delete
- Preview Output Dataset
- Export to S3
- Save Dataset as Design Template
To access the Preparation tab in Data Designer, navigate to Administration > Data Designer, and open an existing design you wish to edit (or) click New Design to create a new one, enter the Details and navigate to the Preparation tab.
Edit Dataset
To edit a Dataset, click the Edit icon (or) click Options, and then click Edit to edit a dataset. You are navigated to the page where you can see Details & Summary, Fields, and Filters tabs.
Details & Summary
You can see the following options in the Details & Summary tab:
- Object Name: Displays the Original Name of the Object that specific Dataset is built on.
- Data Source Name: Displays the name of the Data Source.
- Output Dataset Name: In the Output Dataset Name text box, type In the Dataset Name, if you want to edit the Dataset Name.
- Description: Enter the Description of the Dataset as required.
- Fields & Filters: You can view a list of Fields (including Group By, if any) and Filters in the Dataset.
Fields
You can see the following options in the Fields tab:
- Search Fields: In the Search Fields text box, type in the Field Name you want to search for. Search operation happens on the fields available in the Dataset.
Note: When a user enters the Field name, the search functionality fetches the fields from the base object. To further extend your search on lookup objects, ensure that you expand the lookup object before you make a search. - Add Fields: Click Add Fields to select the required fields you want to add to the dataset, and then click Select.
- Group By: You can select the required fields to Group By, to slice and dice the data in the dataset. Once you select a Field to Group By, all the other fields in the dataset become aggregated.
- When Group By is selected, custom fiscal year can be applied to Date and Date-Time fields.
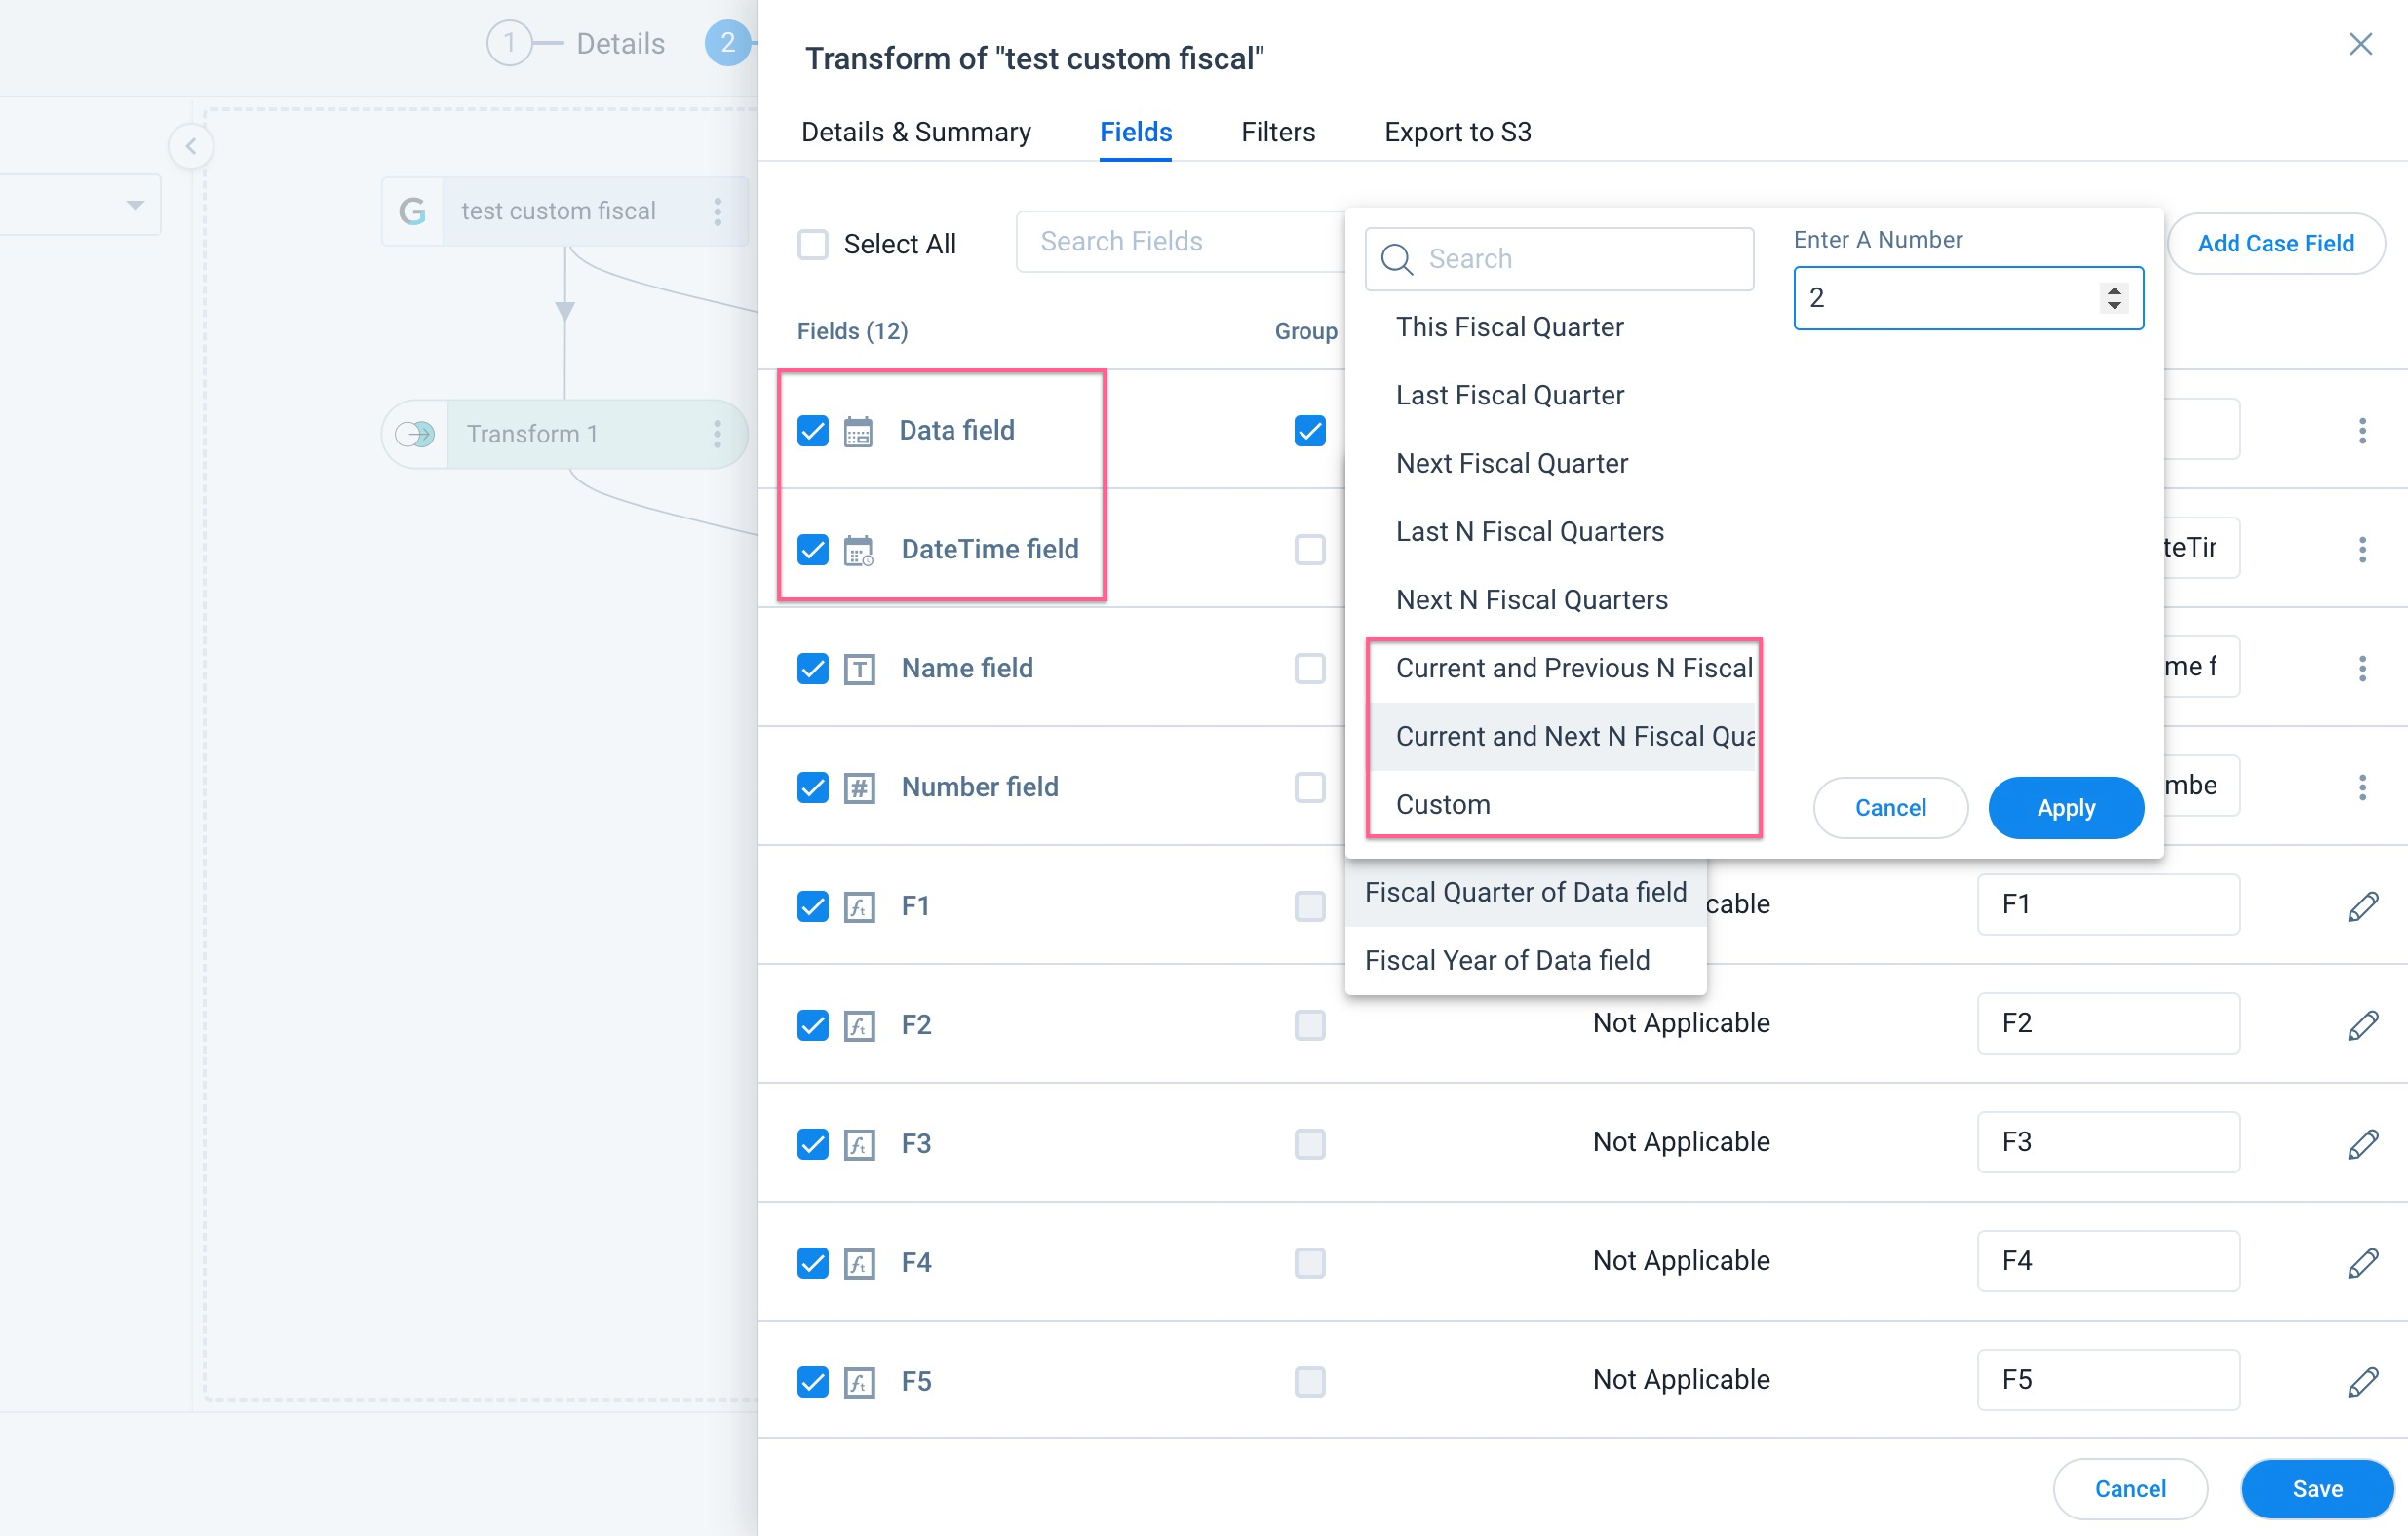
- When Group By is selected, custom fiscal year can be applied to Date and Date-Time fields.
Note: Configure the custom fiscal year to use this in the Data Designer.
For more information on how to configure a custom fiscal year, refer to the Application Settings article.
- Aggregation: You can select the required aggregation type from the Aggregation dropdown list.
- Display Name: By default, Field Name name appears in the Display Name text box, if required you can modify it. Display Names are shown in the Datasets/reports.
- Settings:
- For the numeric data type fields, you can set the decimal places. Click the Settings icon to enter the decimal places you want to set
- If the Salesforce Picklist/Multi-picklist fields you wish to set-up has already been added to the dataset:
- Click the Settings icon in the right corner.
- Enable the Convert to Picklist toggle button
- Select the required dropdown list from the Map to MDA Dropdown List.
Notes:- Before you map the Salesforce Picklist to Gainsight’s Dropdown list, ensure that you have already created an equivalent Dropdown list in Gainsight. For more information on how to create a Dropdown/Multi-select Dropdown list, refer to the Dropdown List and Multi Select Dropdown List article.
- If you have not created an equivalent MDA Dropdown in Gainsight and mapped to the required Salesforce Picklist, the values are shown as null.
- After the setup is complete, users can see the Picklists in Gainsight’s Filters and Global Filters.
- To change the data type of a Picklist:
- Click Settings and select Duplicate Field. The String data type of Picklist is displayed.
- Delete: Click the Delete icon to remove a field from the dataset.
Note: If you try deleting a field from a dataset that is a dataspace, Data Designer displays a notification that informs you to Check Dependencies. This prevents you from accidentally deleting a field that is already used in a dataspace. - Save: Click Save to save the changes made in the dataset.
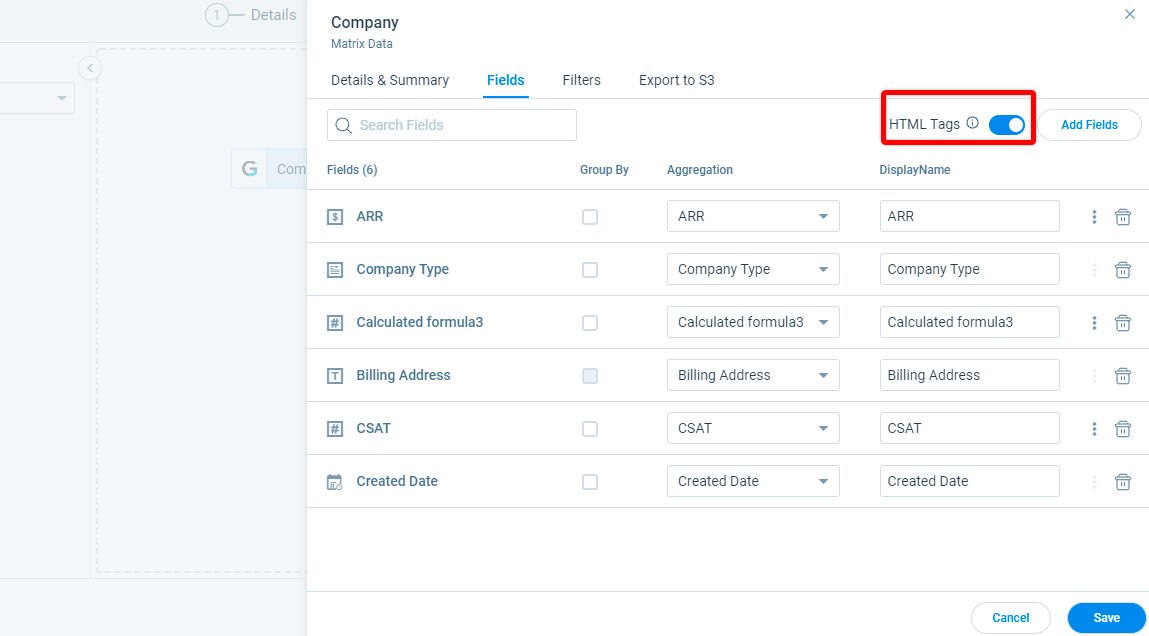
-
HTML Tags: The HTML Tags automatically detects Rich Text fields. By default the HTML Tags switch is Toggled On.
Note: The HTML Tag is useful for exporting to S3 and for maintaining single data consistency.
Cascade Add
Cascade Add functionality allows you to add a field to a dataset, and thereafter this field automatically gets added to all of the next datasets (end tasks) in that design.
Notes:
-
The default aggregation of the Measure type field added using Cascade Add functionality is Sum. Once the field is added, you can change the aggregation based on your requirement.
-
The default aggregation of the Dimension type field added using Cascade Add functionality is Count. Once the field is added, you can change the aggregation based on your requirement.
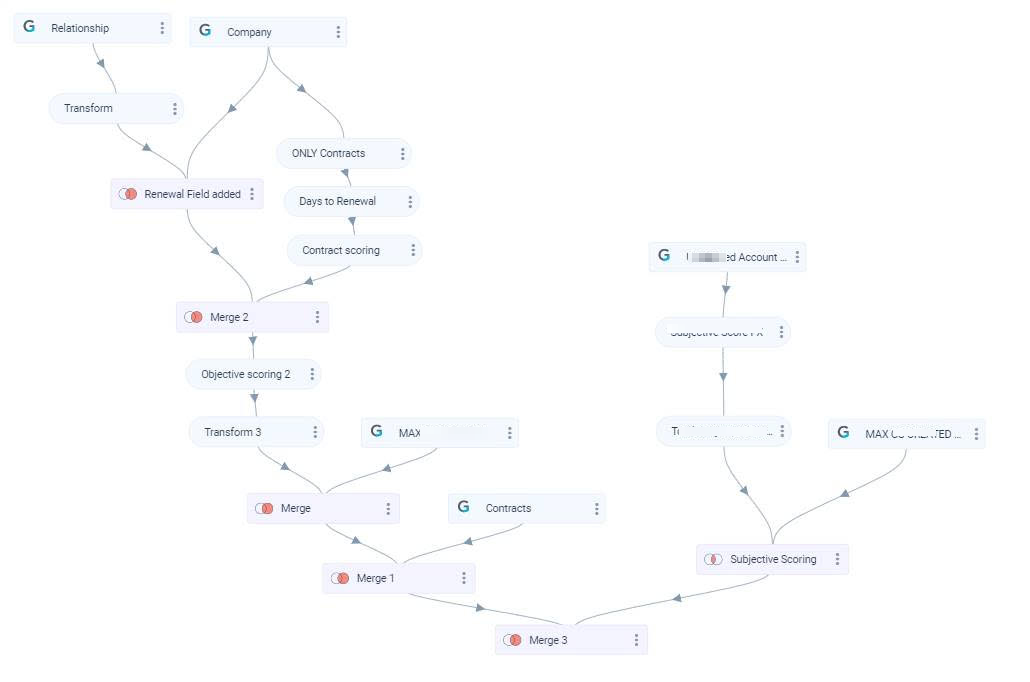
Assume, you have a design as shown in the following image, and you might want to add a new field to the end task. Instead of adding the new field to each of the tasks separately from the starting, using Cascade Add functionality you can add the new field to all the tasks at a time by adding that field to the parent dataset.
To perform Cascade Add:
- Click Add Fields.
- Select the required fields.
- Click Select.
- Click Save. The Newly added fields window appears.
Note: You can see the list of new fields in this window. - Click Yes Add, to add the selected new fields to the end tasks.
Cascade Delete
Cascade Delete allows you to delete a field from a dataset, and thereafter this field automatically gets deleted from all of the subsequent datasets in that design.
If the design is a Dataspace, and when you try deleting a field from the last dataset, a notification is displayed to Check Dependencies across other functionalities of Gainsight.
To perform Cascade Delete (Design is a Dataset):
- Click the Delete icon.
- The Field(s) being used in other tasks dialog appears.
- Click Yes Delete to delete the field from the subsequent datasets.
- Click Save.
To perform Cascade Delete (Design is a Dataspace):
- Click the Delete icon.
- The Field(s) being used in other tasks dialog appears.
- Click Delete Field(s) Anyway to delete the fields from the subsequent datasets (or) click Check Dependencies to view the dependency of that field across other functionalities of Gainsight.
- If you have selected Check Dependencies in the previous step, click Yes Delete or Don't Delete after checking the list of dependencies.
- Click Save.
Filters
To apply Filters:
- Navigate to the Filters tab.
- Click Add Filter.
- Select the field you want to filter on.
- Choose the operator and then input the data in the Value text box.
Notes:- You can also Add more filters by clicking the + icon next to Value text box.
- You can Delete a filter by clicking the x icon.
- You can add advance filters such as (A OR B) AND C, type in your desired expression in the Advanced Logic text box.
- Click Save.
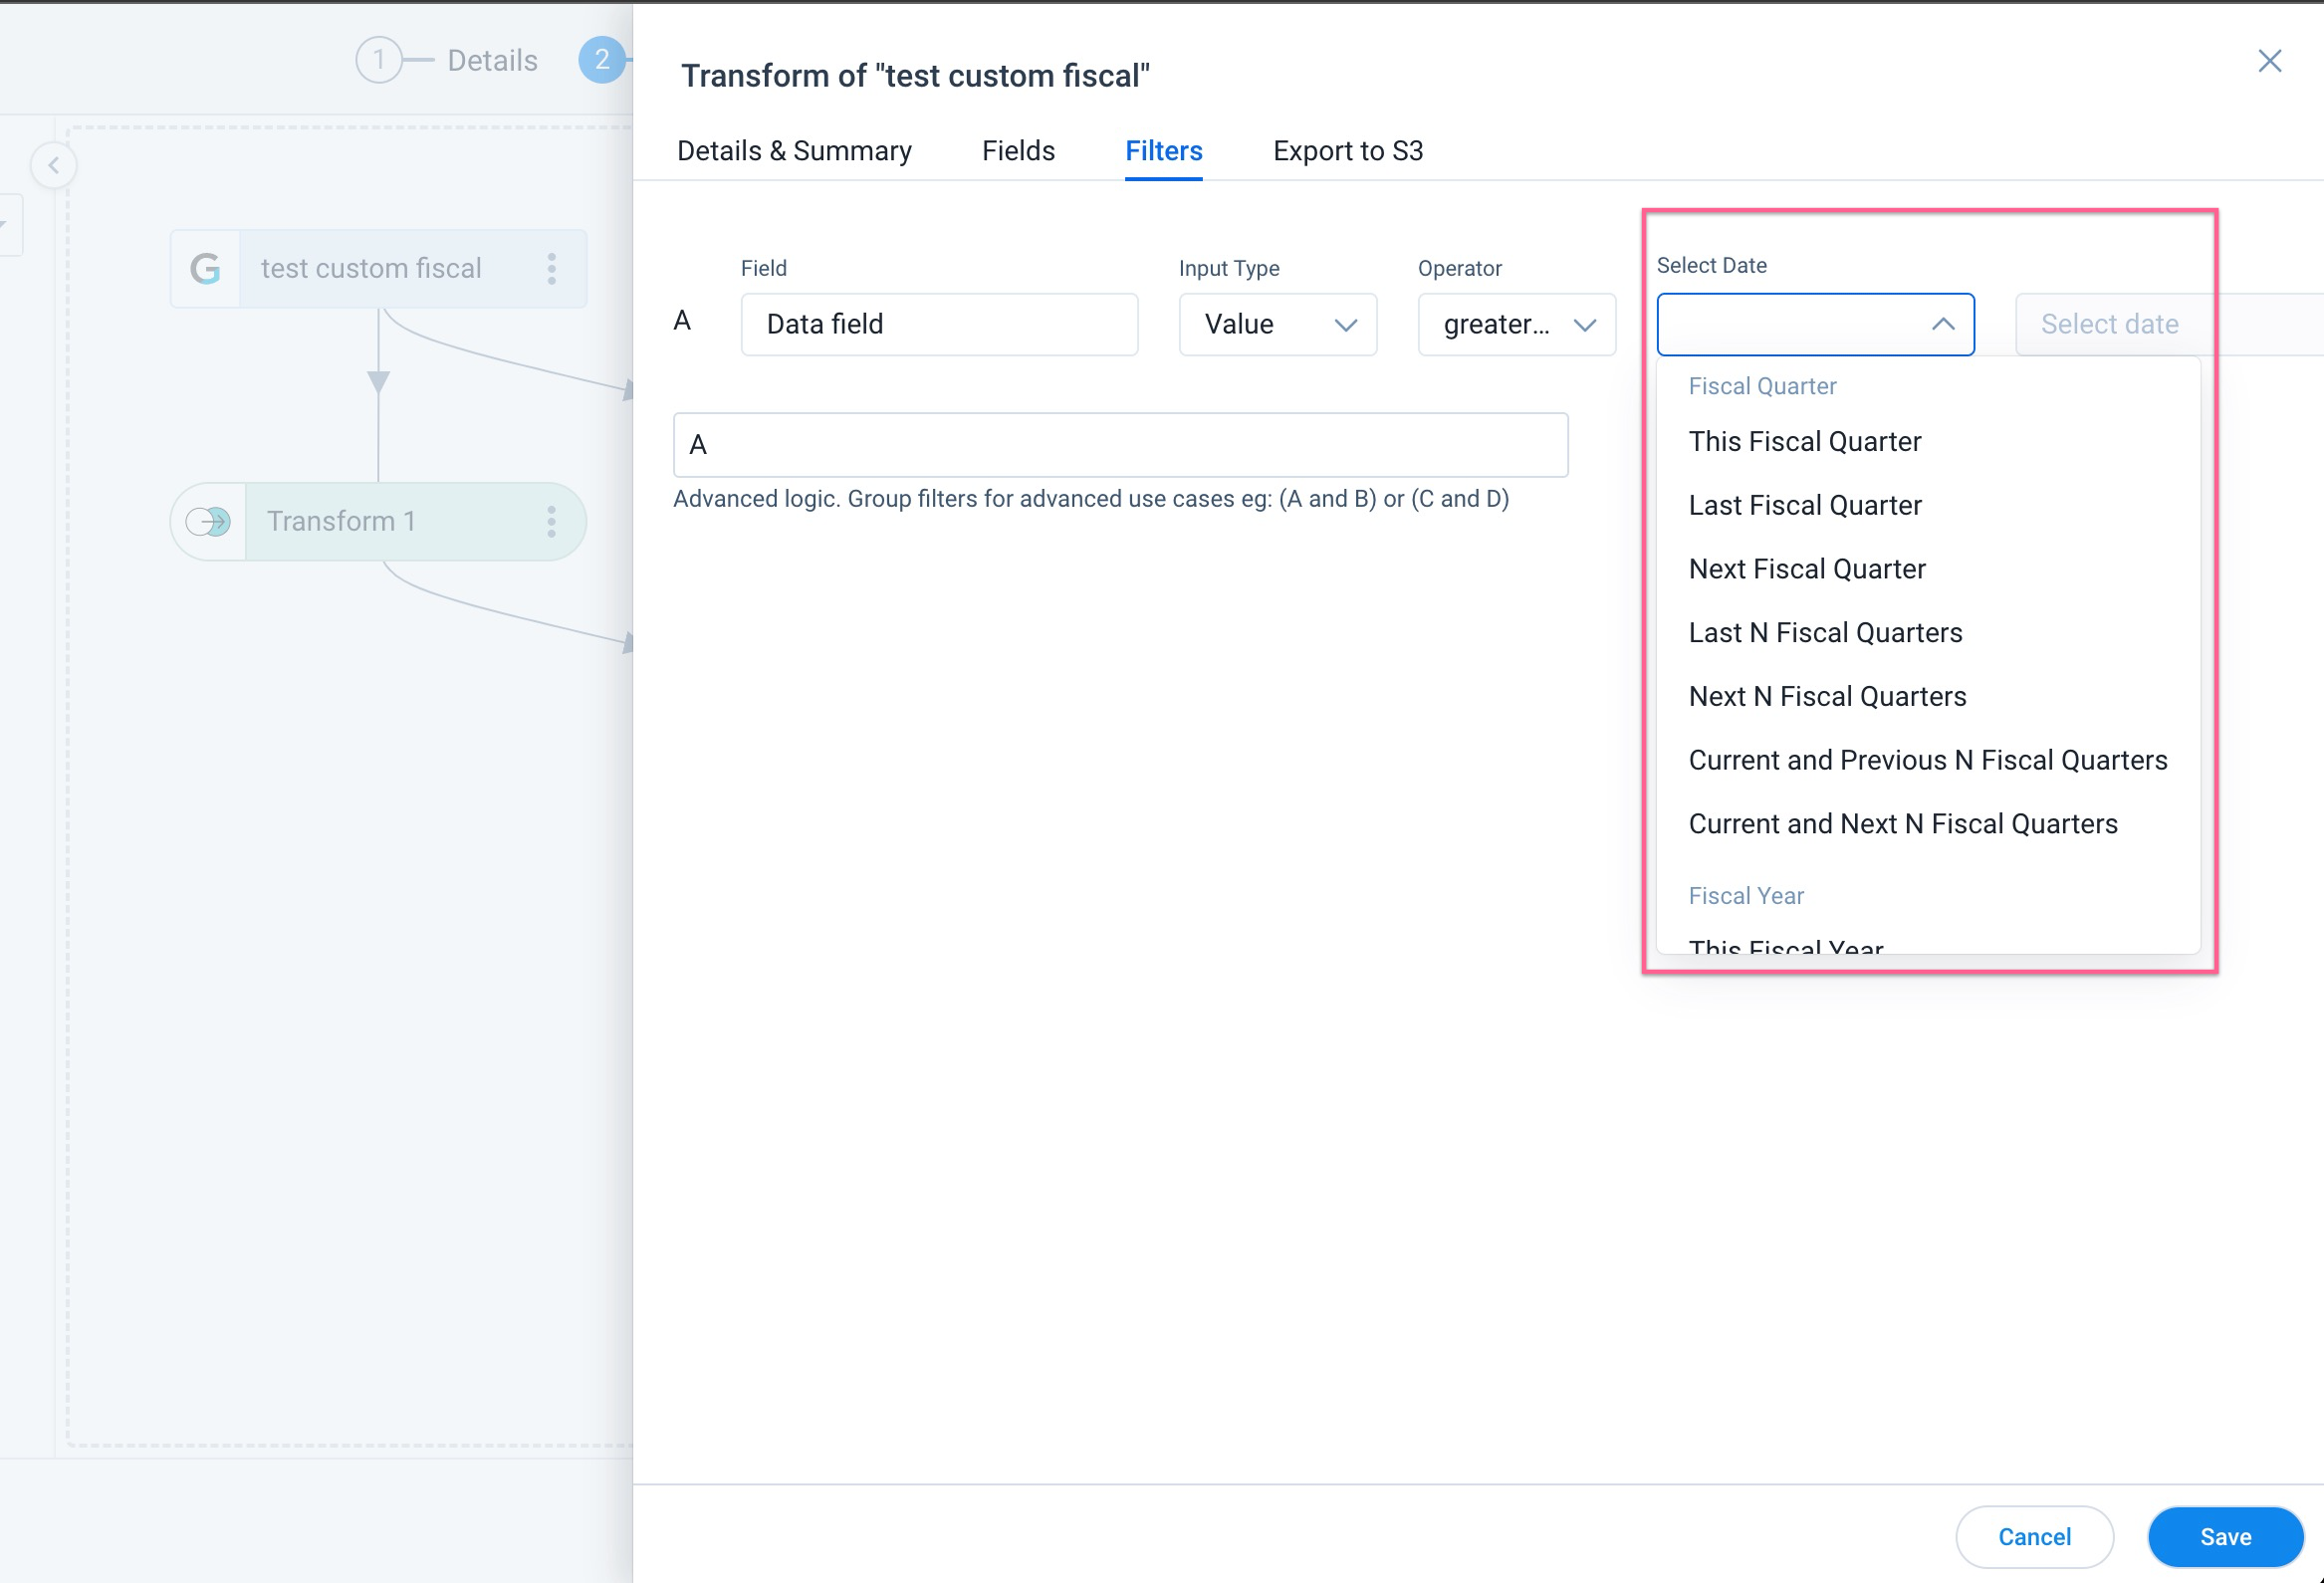
Custom Fiscal Period Filters
Custom fiscal period filters can be applied to Date and Date-time fields. To apply the filters:
- Navigate to the Filters tab.
- Click Add Filter.
- Select the Date or Date-time field you want to filter on.
- From the Input type dropdown select Value.
- From the Operator dropdown, select the operator.
- From the Select Date dropdown, select fiscal quarter.
- In the Value field, enter the value.
- Click Save.
Mappings
Data Designer auto imports the mapping information present in Gainsight Data Management. Mapping is used by other functionalities of Gainsight, such as Reports, Rules, and JO to identify core fields such as Company Name and treat it specially. (Hyperlinks, Filters auto suggest).
Mapping is the mechanism which Gainsight applications use to identify special fields such as the Company Name, Relationship Name, User Name, CTA, and Timeline Subject across Gainsight.
IMPORTANT: To support mappings for a Name field, you must also add the corresponding ID field and carry it to the last step of Data Preparation.
Refer to the following table to see how to make mapping work.
| Object | Field for which mapping is required | Mandatory Field to carry forward until last task |
|---|---|---|
| Account | Account Name | Account ID |
| Relationship | Name | GSID |
| Company | Name | GSID |
| User | Name | GSID |
You can apply a Global Filter on Company Name on reports created on Company Object and Data Space from Data Designer.
You can see hyperlinks in reports created on a Data Space. For example, you can see Company Name, and Relationship Name records in reports as hyperlinks, and can also see auto-suggest in Reporting filters.
Transform
Transform allows you to apply Formula Fields and Case Expressions on the fields added to the dataset.
To apply Transformation on a dataset, click Options on the dataset you want to apply transformation, and then click Transform. A new window with the dataset name ‘Transform’ appears, where you can see Details & Summary, Fields and Filters tabs.
Fields
After you apply Transformation on a dataset, you can create Formula Fields and Case Fields upon the fields added to the transformed dataset.
Formula Fields and Case Fields in the Preparation Details of Data Designer work as the Formula Fields and Case Fields in Bionic Rules. For more information on how to create Formula Fields and Case Fields, refer to the Formula Fields and Case Fields article.
All the other options in the Transform > Fields tab work as the options in the Fields > Edit Dataset and Fields > Merge.
Add Formula Field
To create a Formula Field:
- Click Add Formula Field.
- Enter the Formula Field name in the Label text box.
- Select the required Data Type (String or Date or Number).
Notes:- Select the data type, based on the output field you want. For example, if you want to see the output as the number of days/weeks/months, then select the output data type as number.
- Functions and Fields may differ based on the selection of the data type.
- For Number data type, you can select the Expression Type as Function or Expression from the Expression Type dropdown list.
- For Date and Date-Time fields, custom fiscal periods can be added to String data type. Use the following functions to build data designs:
- Calendar Label
- Fiscal Quarter Label
- Fiscal Year Labe
- Select the required Function of your choice, and then select/enter the Values and/or Fields.
- Click Save to save the formula field.
- Click Save to save the Transform dataset.
You can preview the records of the newly created formula fields, by clicking Preview on the Transform dataset.
Add Case Field
You can use the Case Expression formula field to categorize data, based on specific set of requirements. You can use this Formula function to create an output Field. This output field has values for the records that match your specific set of requirements.
Case Fields in the Preparation Details of Data Designer work as the Case Fields in Bionic Rules. For more information on how to create Case Fields, refer to the Case Fields article.
To create a Case Field:
- Click Add Case Field.
- Label: Enter the Formula Field name in the Label text box.
- Select the required Data Type (Number/String/Boolean). The options present in the Case Output depends on the Output data type.
Note: If you select Number in the Data Type, select the number of decimal places up to which the output must be displayed, for floating point numbers. - Case: Case consists of the Criteria(s). You can add multiple criteria by clicking +.
- Criteria. The various fields present in a Criteria are:
- Field: Select the field on which the Criteria must be applied. All the fields included in the Dataset are displayed.
- Operator: Select an Operator to be applied on the field. The operators are displayed based on the field selected.
- Matching Criteria: Select the matching criteria which must be satisfied, for this criteria to be successful. You can either select:
- Value: Enter a value which must match the field value.
- Field: Select a field whose value must match the value of the field, selected in the first field.
- Advanced Logic: When you have multiple criteria, select the logical operator to be applied between those criteria(s). By Default, the AND logic is applied.
- Then: If all the criteria(s) are matched, the action specified in this field is executed. The options available in this field depend on the value selected in the Output Data Type field.
- Default: This field represents the default case. There are no criteria for this case. It only has action. If all the cases fail, this case is executed.
- Click Save to save the case expression.
- Click Save to Transform dataset.
Execution of the Case Expression in detail:
- Execution of the Case Expression begins with the evaluation of the first case on a record. If all the criteria, in this case, are satisfied by the record, the action associated with this case is executed. The execution of Case expression halts here for this record and none of the other cases are evaluated.
- However, if the first case is not satisfied, the system evaluates the second case on the same record, and so on. If none of the available cases are satisfied by the record, the default case is executed.
Filters
Filters in Transform work as Filters in Edit Dataset. For more information, refer to the Filters section.
Details & Summary
Summary details in Transform are the same as Details & Summary details in Edit Dataset. For more information, refer to the Details & Summary section.
Merge
You can merge datasets in the following ways:
- Click Options on the dataset you want to merge, and then click Merge and select the required dataset. (OR)
- Drag and drop the first dataset on to the second dataset.
After you merge the datasets, a new window with the dataset name ‘Merge’ appears, where you can see Details & Summary, Join, Fields and Filters tabs.
Join
Basic JOIN clauses are used to combine rows from two or more tables, based on a common field between them. There are four types of Joins supported in Gainsight: Inner Join, Left Join, Right Join, and Outer Join. Each join type, when used with a Merge task in Data Designer, produces a slightly different data set. For more information, refer to the Join Types article.
- Inner Join: this join retains common records from both datasets.
- Left Join: this join retains all the records from the left dataset.
- Right Join: this join retains all the records from the right dataset.
- Outer Join: this join Retain all records from both datasets.
To Join two datasets:
- Navigate to the Join tab.
- Select the required Join type.
- Select a field from each dataset to set the criteria. For example, the Company Name in the first dataset is Name, and Company Name in second dataset is Company Name.
- Click + to add multiple field mappings. This helps filter the records.
- Click Save.
Fields
You can see the following options in the Fields tab:
- Search Fields: In the Search Fields text box, type in the Field Name you want to search. Search operation happens on the fields available in the Dataset.
- Select All: Select/Deselect the checkbox to Add/Remove the fields from the merged dataset (or) You can also select/deselect the individual field checkboxes.
- Display Name: By default, Field Name name appears in the Display Name text box, if required you can modify it. Display Names are shown in the Datasets/reports.
- Save: Click Save to save the changes made in the merged dataset.
Filters
Filters in Merge work as Filters in Edit Dataset. For more information, refer to the Filters section.
Details and Summary
Summary details in Merge are the same as Details & Summary details in Edit Dataset. For more information, refer to the Details & Summary section.
Union
Union function in Data Designer combines the two datasets in a way that all the similar type fields automatically get unified into one dataset. If there are any other fields in the two datasets that are not similar, you can select and add them.
Business Use Case: For example, you want to combine the data of two objects (with similar fields) that have the data from Europe and US region customers.
Notes:
- Unified fields inherit the properties of Master fields such as Data Type, Decimal Points etc.
- Other than Unified fields, you can also add additional fields from the datasets. If there is no data in the columns, it is considered as Null.
- You can select either to remove or not to remove the duplicate fields in the output data.
To use Union function:
- Click Options on the dataset you want to apply union, and then click Union and select the dataset. You are navigated to the Union tab.
- Select the Union Type. You can select from the following options:
- Union: Select this to remove duplicates in the output data.
- Union All: Select this to retain duplicates in the output data.
- In the Map Fields to Merge section, select a field from each dataset to set the merge criteria.
- Click + to add multiple field mappings, if required. This helps you filter the records.
- Navigate to the Fields tab to view the Unified Fields, select the Master Field (from the datasets), select/deselect the fields, and change the Display Name of the fields.
Note: You can also select additional fields from the dataset, if required. - Click Save.
Pivot
In a dataset, the Pivot task transforms the data available in a single table column into multiple columns in one go. The Pivot task creates a column for every single data value in the table column. This enhances the data summarization process to get better insights into the data.
Pivot Function: Pivot rotates a table-valued expression by turning the unique values from one column in the expression into multiple columns in the output.
Example Business Use Case: A Customer Success Director wants to find patterns in CTA Type by CSM and optimize CTA Types, and so on.
To use the Pivot functionality, navigate to the Administration > Data Designer > Open a Dataset > click Options > click Pivot.
For more information on how to Pivot on the CTA Type Name field, refer to the Pivot Task in Data Designer article.
Auto Arrange Datasets
With the Arrange Design option, you can automatically arrange the datasets in the Preparation tab, with a single click. If there are numerous datasets in your design, you can make use of the options such as, Zoom In and Zoom Out and Pan as shown in the following image.
Preview Dataset
To Preview Dataset, click the eye icon (or) click options, and then click Preview Dataset. In Preview, you can view up to 2k records.
Preview for Merge and Transform, will display initial 2k records and in some cases this might result in smaller datasets or no rows.
Maximize: You can also view the sample data in a full screen view by clicking the Maximize icon on the Preview tab.
Refresh: Click the Refresh icon on the Preview tab to refresh the sample data, if you have edited the dataset.
Sort operation: This option enables you to sort all the records when there is a large dataset.
Delete
If you wish to delete a dataset permanently from a Data Design, click Options, and then click the Delete icon.
Preview (Output Dataset)
To Preview Output Dataset:
Click Preview on the upper right corner of the Design page (or) Navigate to the output/last dataset in the design, Click the eye icon (or) click Options, and then click Preview.
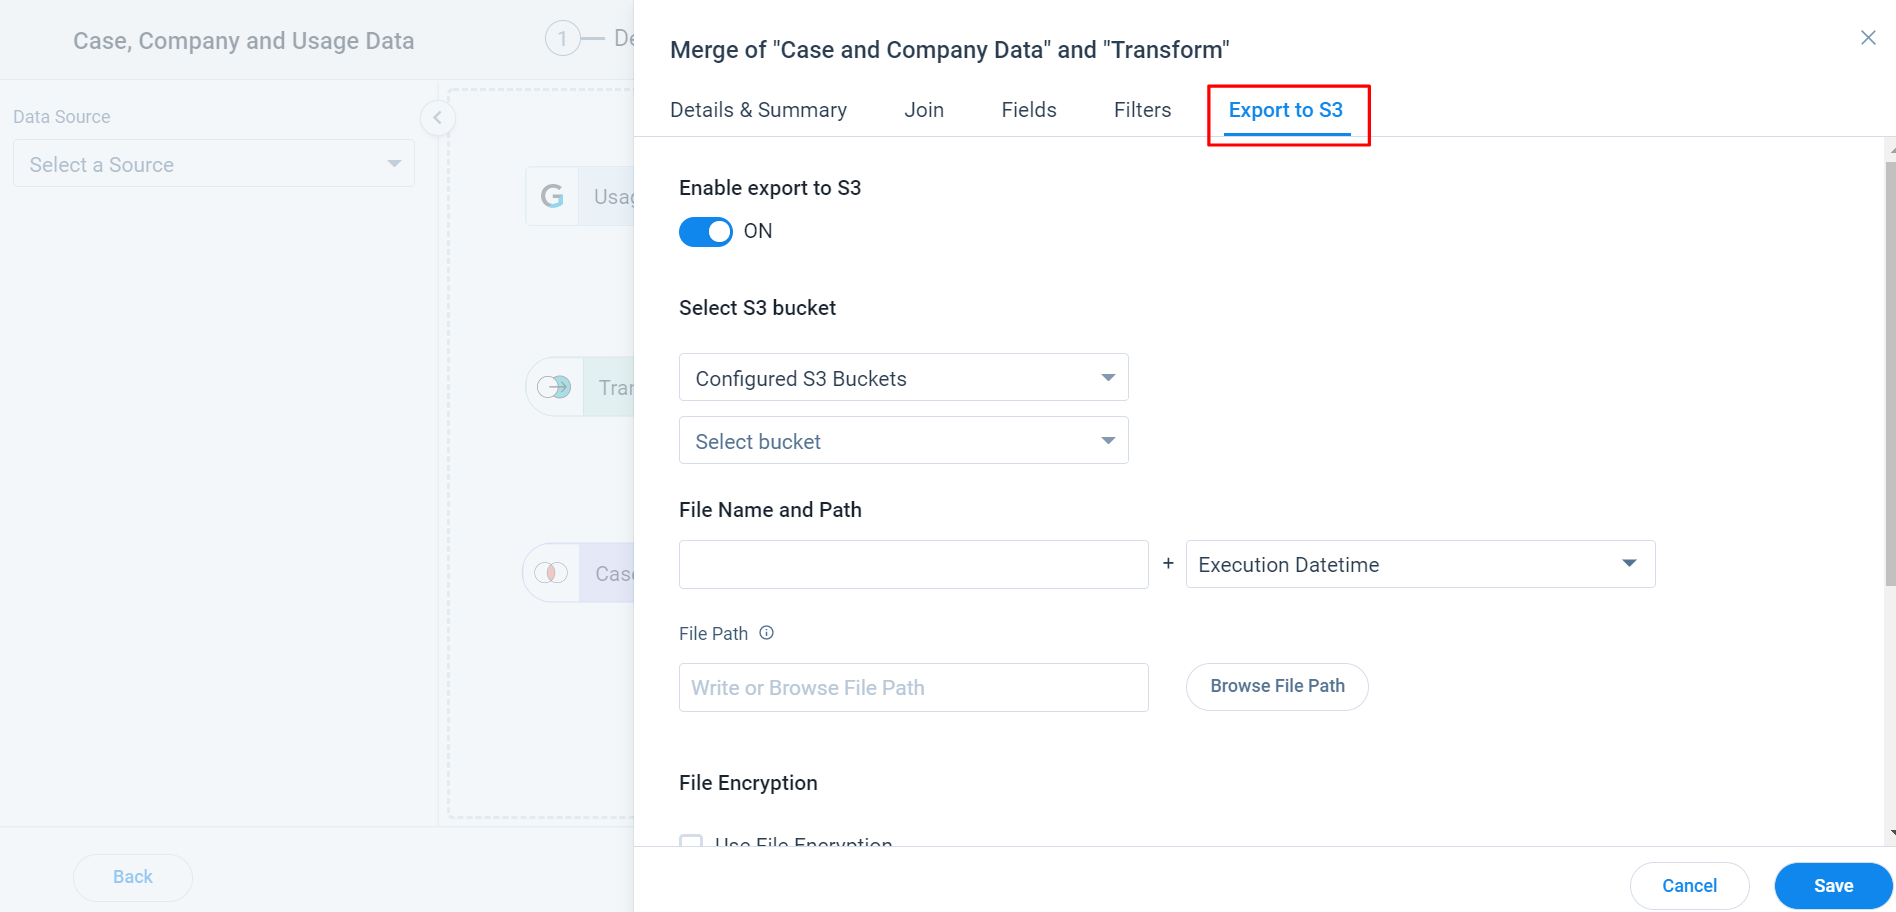
Export to S3
The Export to S3 feature allows you to export output data at a dataset level directly from the Preparation tab to the Amazon S3 bucket. For more information on the overview and how to export data to S3 from Data Designer, refer to the Export to S3 from Data Designer article.
Save Dataset as Design Templates
Once the dataset is created, users can save this design as Design Template, that can be used as a base design for creating similar dataset with variations.
To save a dataset as Design Template:
- Click Save As.Save As Design Template dialog is displayed.
- From Save as Design Template dialog, select one of the following options:
- Save as New to save a new Design Template.
- Select Update Existing, to update an already existing template.
- Click Save Template.
For more information on how to use the Design Template, refer to the Design Templates in Data Designer article.